

The Timber Trade Federation (TTF) has launched a member and stakeholder survey on the Responsible Purchasing Policy (RPP), its due diligence framework, to better aide compliance with legality and sustainability matters.
The online survey, accessible here until Friday 8 April 2016, is part of the TTF’s Strategic Development review of its RPP, aiming to improve the industry benchmark for legal and sustainable sourcing.
The RPP has been in existence for over 10 years, providing members of the Federation with a solid foundation on which to build their compliance processes. TTF members are required to have in place a system of due diligence covering all timber purchases within their businesses. The key requirement of such a policy is to implement detailed due diligence on the species, country of origin and supply chains from which they source their products and to report to the TTF annually on certain criteria
The TTF provides its members with a framework of due diligence and a set of tools that allow them to focus their resources on products and suppliers where there is a higher risk of illegal timber entering their supply chains. It complements existing risk management already in place, such as product certification and provides further assurance that organisations have robust and systematic risk management measures in place.
Dave Hopkins, Managing Director of the TTF said: “The RPP is central to TTF values, membership and reputation. Yet, the market for responsible sourcing has changed dramatically since its start. We need to make sure that we are changing with that market. This review will allow us to assess the current system, compare it against the needs of our customers and develop it accordingly. We want to ensure that the market knows it can trust a TTF member.”
About Timber Trade Federation
Since 1892, the Timber Trade Federation (TTF) has been the leading UK body representing timber traders, agents, importers, manufacturers, merchants and sawmillers. The TTF is at the forefront of promoting timber as the world’s leading renewable, low carbon construction material.
[gravityform id="1" title="true" description="true"]
[gravityform id="2" title="true" description="true"]
Article archive
Amec Foster Wheeler to supply biomass dust combustion plant to Finnish utility company

Amec Foster Wheeler won a contract for supplying for the Finnish utility company Seinäjoen Energia. The UK engineering company will furnish the biomass dust combustion plant with biomass based fuels, such as wood pellets, briquettes, bark and pellets from forest residues.
The Finnish plant will be used as a back-up plant to increase the capacity of the load district heating plant to 120MWth and its heavy fuel oil combustion will be replaced by the materials mentioned above, together with peat pellets and agrofuel pellets, while coal will remain as a reserve fuel.
The operations at the plant will begin in December 2016, while the work on the installation will proceed this spring. Also, the operations will have to respect the requirements of the environmental permit, regarding the emissions.
“This investment increases significantly the share of renewable fuels in Seinäjoen Energia heat production,” said Martti Haapamäki, CEO of Seinäjoen Energia.
Also, Amec Foster Wheeler wants to build auxiliary equipment for a new 90MWth biomass pellet dust boiler. The oil will thus be modified to 30MWth wood pellet firing, with new storage silos and handling equipment for biomass fuels, along with flue gas cleaning systems.
Amec Foster Wheeler (www.amecfw.com) designs, delivers and maintains strategic and complex assets for its customers across the global energy and related sectors.
About Amec Foster Wheeler
Employing around 40,000 people in more than 55 countries and with 2015 revenues of £5.5 billion, the company operates across the oil and gas industry – from production through to refining, processing and distribution of derivative products – and in the mining, clean energy, power generation, pharma, environment and infrastructure markets.
[gravityform id="1" title="true" description="true"]
[gravityform id="2" title="true" description="true"]
Sweden seeks opportunities in the rising Japanese wooden house building
New opportunities arise in the Japanese construction sector for the Swedish lumber. Swedish Forest Industry President, Carina Håkansson (in the second photo), went this March to Japan together with the Swedish Rural Minister, Sven-Erik Bucht. The two officials participated at the “Treasures of the Forest” program, which will strengthen the dialogue between the two countries in sustainability issues, large wooden buildings and new applications, according to Skogs Industrierna.
 The program was organized by the Embassy of Sweden, Business Sweden and Growth Analysis in Japan.
As Skogs Industrierna reported, Olle Pettersson, of the Swedish Embassy in Japan, believes that the ongoing evaluations are going very well, as new connections between the forest industries in Japan and Sweden are to be created.
“The forest industry is a very exciting area for cooperation between the countries. There are sharp contrasts in areas such as competitiveness, forest management and approach to sustainability. There are also similarities, such as in innovation where both countries are at the forefront in research on new materials such as nano-cellulose. Both similarities and differences provide opportunities for increased exchange,” said Pettersson.
Japan is already an important market for Swedish wood. 10% of the total Swedish exports to  Japan consist of forestry and wood products, and Sweden exports reach a value of over two billion per year.
Carina Håkansson, President of the Federation, felt that interest in building high wooden house was great.
“In Japan, many houses are built of wood, but not much in height. We got many questions, not least about the sustainability aspects. Speaking of durability, Sweden's sustainable forestry can be a model for Japan”, said Carina Håkansson.
Japan has just as much forest as Sweden, but does not use it to the same extent, said Ms. Håkansson. Part of the explanation for this is that the terrain is difficult and on steep. Forest owners are not as active. Many do not know exactly where is the boundary between his forests and those of his neighbours.
[gravityform id="1" title="true" description="true"]
[gravityform id="2" title="true" description="true"]
Construction activity outlook in Europe brightens

The Dutch construction sector shows positives results and recovers at a fast pace. The predictions for the coming two years are in the Netherlands most positive of all important European countries. But also Southern European country as Spain shows us very positive figures although this market was hit hard in recent years, according to a Arch Vision analysis.
In France the constructions sector is slowly starting to show some improvement, start of recovery is therefore expected in 2017. Even the Italian market, however still showing negative figures is somehow stabilizing which could indicate that we can expect a recovery in this market in 2017 as well. These are some of the conclusions of the Q3 2015 European Architectural Barometer report, a quarterly research among 1,600 architects in eight European countries. European architects act as a leading indicator for the construction activities.
The British market is improving, but its increase is still not stable. One of the reasons for this is that the building permits for residential buildings show increases but also decreases in the last few quarters. Next to that none of the confidence indicators show real big improvements in the last quarter. However there are also positive signs which influence our model to a high degree. The Arch-Vision indicators however are showing positive signs, e.g. the sentiment within architectural firms is positive in Q4 2015: again the order book and turnover development are quite positive. The first two indicators have a positive effect on the rolling barometers. Also the amount of architects expecting an empty order book is decreasing throughout the last three quarters. Nevertheless there are signals that one should be careful about the future. The building permits for residential buildings showed a decline late 2014, which means this will come into effect in two to three years. Arch-Vision therefore predicts a growth of the market in 2016 (+3%) which will continue in 2017 (+2%) and 2018 (+2%).
From Q3 2010 onwards there has been a steady positive development among the German architects. However 2015 turned out to be less steady: both the Rolling Order Book Barometer and the Rolling Turnover Barometer grew substantially in Q1, while the developments in Q2 were still positive but smaller as in the first three months. Q3 and Q4 however are at the same level for the Rolling Order Book Barometer as Q1: the Rolling Order Book Barometer grew by 16 points (316). The Rolling Turnover Barometer is stabilizing and does not show any growth in the last quarter of this year. The development of the building permits for both residential and non-residential is very stable throughout the years 2014 and 2015: respectively at a level of app. 145 and 95 (index 2010=100). Since Germany is a country which relies more on renovation than new build, this will have less impact on the total buildings volumes than other countries. The concerns we had earlier have not been taken away completely: although the construction confidence is increasing, the other two aren’t (industry and consumer). Therefore Arch-Vision expects modest growth figures which are not as high as in the beginning of this decennium: 2016 (+2%), 2017 (+1%) and 2018 (+1%).
The French construction sector is slowly starting to show some improvement. Lasts quarters we stated that the sentiment was becoming less negative, which became even clearer this quarter. The Rolling Order Book Barometer, however still quite negative, shows an increase for the first time since Q1 2011 (+17). Also the Rolling Turnover Barometer is stabilizing. Another positive indicator for the French construction market is the amount of architects expecting an empty order book. Less than a quarter expects this to happen within the next twelve months. Other indicators are also showing some movement to a positive sentiment. The industrial and consumer confidence indicators are stable, whereas the construction confidence indicator has improved slightly. All three are however still negative. The building permits show some improvement as well. Therefore ArchVision predicts that the French construction market will still decrease in 2016 (-2%) and 2017 (-0.2%) and will start to recover from 2018 onwards (2018: 0.4%).
The indicators are looking quite positive for Spain. In Q4 2015 the Rolling Order Book Barometer and the Rolling Turnover Barometer shows positive signs, however they are still way below the point of before the crisis. The small setback seen in Q3 2015 seems to be ignored in Q4 which is positive. The slightly less positive attitude is also reflected in the development of the building permits and the amount of architects with cancelled projects, for the third quarter in a row this percentage has increased (Q4 2015). The permits for residential buildings show, despite some fluctuations, a small increase in the past two years, and the permits for non-residential show a big increase over the past 12 months. The confidence indicators reflect this (temporary?) pause in developments: the construction confidence indicator picked up again, is however still negative. The consumer confidence indicator showed a big increase in the last quarter of 2015. Given the latest results Arch-Vision concludes that the development in 2015 (+4%) was better than the one in 2014 (-2%). The years after 2015 will show the road to recovery of the Spanish construction sector (2016: +4% 2017: +5% and 2018: +6%).
There are still some drops in the order book and turnover development in Italy, but since Q2 2015 the drops are smaller than those from Q1 2014 onwards (Q4: 18 points versus 23 and more in previous quarters. Again, more and more architects see an increase in their order book (20%). However still a largest amount of architects (39%) noticed a decrease in their order book. Italy is the worst performing country. Improvement of the construction market in Italy seems to be far away, but there are some – although minor – positive signs. The latest available data on building permits show no big decreases as they used to show. This will have its influence on the construction sector in the 2 – 3 years after the building permits have been granted.
This same trend can be seen when looking at the confidence indicators: stabilization or only small differences. Therefore the outlook for the next twelve months is still not very promising. Arch-Vision predicts a shrinkage of the market by 2% in 2016 and by 0.1% in 2017. Growth of the Italian building volumes is not expected before 2018 (0.0%).
For the whole of 2014 the Dutch order book and turnover development were positive and they keep on being positive in 2015 (142 for the order book and 125 for the turnover in Q3). The Rolling Barometers are the highest since 2011 and 2012 (Rolling Order Book Barometer: (+2!) and Rolling Turnover Barometer -24) resulting in the first positive Rolling Order Book Barometer since the start of the measurement. The number of architects experiencing improvements (62%) is also the highest since Arch-Vision started the research. At the moment only 6% expect an empty order book within the coming 12 months. The positive architectural sentiment can also be seen amongst other indicators such as the confidence indicator for the construction sector. This shows an increase in comparison to Q3 2015. However the ones for the industry and the consumers are still positive, but not as positive as earlier quarters. Next to that the amount of building permits, for both residential and non-residential buildings, decreased in the past quarter. Therefore Arch-Vision predicts an increase in 2016 (+4%) and even continuously improvement in 2017 (+4%) and 2018 (+5%).
2014 and the first quarter of 2015 showed a quite stable positive development regarding the order books of Belgian architects. In Q2 and Q3 there were even more architects reporting increasing (at least 40% from Q2 2015 onwards, versus 37% at most in previous quarters) order books. This is also reflected in the quarter to quarter Order Book Barometer which is stabilizing (Q4: 116) and the Turnover Barometer (Q3: 110) which is also higher than in 2014.
The building permits figures show positive developments for 2015: increases for both residential and non-residential in 2015 compared to big drops in 2014. The confidence indicators for all three (construction sector, consumers and industry) all show improvements in Q4 compared to Q3. In total this leads to a prediction of the Belgian construction sector by Ach-Vision which is one of a steady and modest growth in future years: +2% (2016), +2% (2017) and +2% (2018).
After the negative order book developments in Q4 2014, which followed positive developments in earlier quarters of 2014, the Polish quarter to quarter Order Book Barometer was positive again in 2015 (at least 103 every quarter) which shows quite a stable order book for architects in Poland. Although the order book developments were positive in the first two quarters, this was not reflected in the turnover developments. The last two quarters of 2015 however show positive signs in the quarter to quarter turnover as well (Q3: 101 and Q4: 105). Poland is a country which heavily relies on new build with respect to the construction sector volumes (almost 75% of its total volumes). Therefore the trend in building permits and turnover development should be watched closely: declining building permits until Q1 2015 and slightly more architects showing negative turnover development in the past 4 quarters will have its impact on the near future. But the increasing turnover developments, the stable confidence indicators and the increasing building permits will have a positive influence on the midterm.
All together Arch-Vision expects that the Polish construction sector will show some minor increases: +2% (2016), +2% (2017) and +2% (2018).
| Country |
Q-to-Q Barometer Order Book Q4 ‘15 vs. Q3 ’15 | Rolling Barometer Order Book Q4 ‘15 vs. Q4 ’08 | Building Volumes 2014 | Forecast Building Volumes 2015 (Q4 2015) | Forecast Building Volumes 2016 (Q4 2015) | Forecast Building Volumes 2017 (Q4 2015) | ||
| Change with regard to 2013 | Amount in 2014 (in billion) | Change with regard to 2014 | Amount in 2015 (in billion) | |||||
| UK | 124▼ | 325▲ | 1% | € 153 | 3% | 3% | 3% | 2% |
| Germany | 116▼ | 316▲ | 1% | € 261 | 2% | 2% | 2% | 1% |
| France | 107▲ | -388▲ | -3% | € 148 | -2% | -2% | -2% | 0% |
| Spain | 128▲ | -643▲ | -2% | € 63.8 | 4% | 4% | 4% | 5% |
| Italy | 82▼ | -965▼ | -5% | € 110 | -4% | -4% | -2% | 0% |
| The Netherlands | 142▲ | 2▲ | 1% | € 45.2 | 3% | 3% | 4% | 4% |
| Belgium | 116► | 112▲ | 1% | € 34.2 | 2% | 2% | 2% | 2% |
| Poland | 105► | -54▲ | 1% | € 32.7 | 1% | 1% | 2% | 2% |
[gravityform id="1" title="true" description="true"]
[gravityform id="2" title="true" description="true"]
Koskisen increases plywood and sawn timber production in 2015
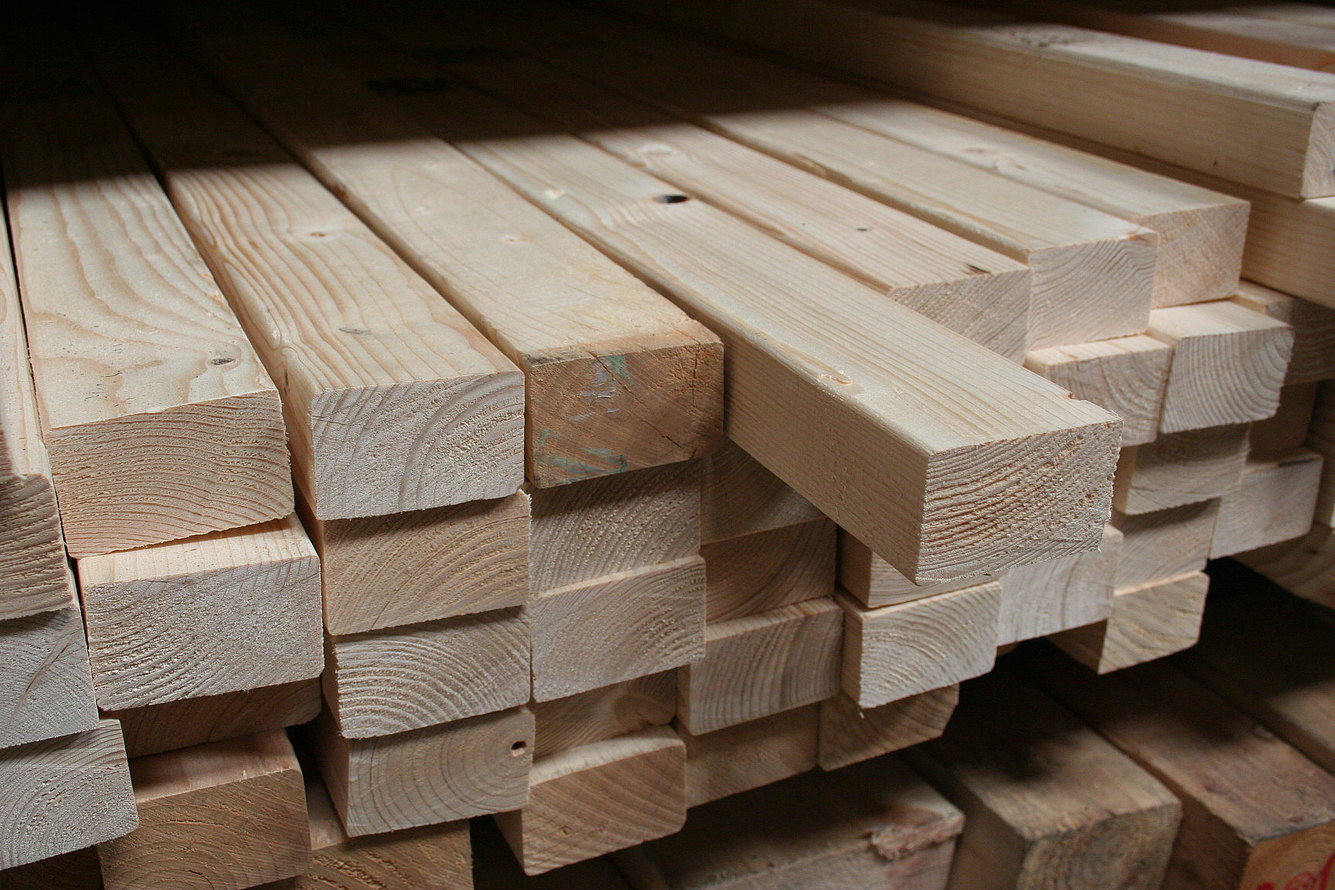
For the Finnish Koskisen Group, 2015 was largely similar to the previous year. The Group’s net sales totalled EUR 247 million, up 2.7% from 2014. The operating profit amounted to EUR 9 million, which is slightly weaker than in the previous year.
Plywood and Sawn Timber production made up 66% of the Group’s net sales. Total net sales of the parent company Koskitukki’s wood procurement was EUR 109 million, including intra-group sales. Exports accounted for 55% of the Group’s net sales and our products were delivered to 64 countries.
Overall, 2015 was a very mixed year: Plywood performed well, while the other business units saw their operations affected by weak domestic demand and a decline in the market prices of sawn softwood. However, the Finnish market price of softwood logs failed to flex correspondingly downward.
Of the EUR 5 million invested during 2015, most was used for replacement and upgrade investments in the plywood mill and the sawmill. In addition, a number of system projects were launched.
Plywood operations benefited from rising prices and improved productivity in the use of raw material. The plywood production increased by 2.36% compared to 2014, up to 737,000 m3. The objective of Koskisen is to ramp up production capacity by 15% this year.
Sawn Timber industry was burdened in particular by the decrease in global market prices and a decline in competitiveness, above all, with regard to Swedish and Russian competitors. Yet, production rose by 4.86%, compared to the previous year, reaching 353,400 m3. Demand for spruce timber seemed to recover somewhat in the latter part of the year, with deliveries to China and Japan in particular being on the rise.
“Koskisen’s year 2015 turned out to be satisfactory. Although we fell slightly short of our targets, we were able to avoid the worst-case scenarios by enhancing our operations. General expectations of growth in domestic demand or the recovery of the global economy are not high. Koskisen is nevertheless capable of developing and growing its sales through a customer-oriented approach, high quality products and successfully targeted investments in accordance with its strategy,” stated Markku Koskinen, Managing Director of the company.
[gravityform id="1" title="true" description="true"]
[gravityform id="2" title="true" description="true"]
Ilim Group to invest US$ 2 billion in its production facilities by 2020

Ilim Group today announced its new Business Plan to 2020, which includes investments of over USD 2 billion into existing production facilities and other operations in Russia. Investments will focus on increasing the Group’s production capacity by over 500,000 tpy.
The overall investment program will cover all three of the Group’s production facilities in Bratsk, Koryazhma and Ust-Ilimsk. The business plan envisages a series of measures aimed at modernization, increasing the efficiency and quality of production, minimizing the impact on the environment and increasing production levels. The mills will be developed further alongside an increase in production of the Group’s own harvesting volumes as well as expanded cooperation with third-party wood suppliers.
Business Plan core items
Ust-Ilimsk. Increase production capacity by over 100,000 tpy. The company is planning to build a new woodyard and modernize treatment facilities.
Bratsk. Increase production capacity by over 300,000 tpy. Improve production quality, build a new woodyard and evaporator station.
Koryazhma. Increase production capacity by over 130,000 tpy. Build new bark boilers and turbines, modernize the recovery boiler, causticizing and lime regeneration plant, as well as paper and cardboard-making machines.
The Company is also considering the possibility of building a new softwood pulp production line in Ust-Ilimsk. The final decision will be taken by the end of the year.
Ilim CEO Franz Marx said: “This is the right decision at the right time - an opportunity to further develop Ilim Group and a chance to increase the competitiveness of the Russian pulp and paper industry as a whole. “We already have a strong track record of successfully implementing large-scale investment projects, and we have set an ambitious goal to expand and upgrade our production facilities in the next five years by investing over USD 2 billion. The successful implementation of our business plan will require the collective effort of the Company's employees, as well as hundreds of contractors and vendors in various Russian regions.”
[gravityform id="1" title="true" description="true"]
[gravityform id="2" title="true" description="true"]
Poland ratifies large-scale logging in the ancient Bialowieza forest

Poland has recently ratified large-scale logging in the Bialowieza forest, the last ancient woodland. The decision comes in an attempt to fight the spread of spruce bark beetle infestation, even if many ecologists together with the EU protested against it, according to The Guardian.
“We’re acting to curb the degradation of important habitats, to curb the disappearance and migration of important species from this site,” said Jan Szyszko, the environment minister.
The Bialowieza forest was marked out a Unesco World Heritage site back in 1979, but the protected areas won’t be a part of the logging plans, as Szyszko promised.
As The Guardian reported, loggers will have to harvest approximately 180,000 m3 of wood on a 10-year period, compared to the 40,000 m3 that had been settled in previous plans. Yet, Greenpeace accused Szyszko that he ignores the protests of many important institutions, such as the European Comission and Unesco.
The recently approved logging plans might violate EU’s Natura 2000 program in Poland and thus it would attract punishments.
The Białowieża forest spreads across 150,000 ha, reaching the Belarus border. It protects 20,000 animal species, 250 types of birds and 62 species of mammals. Its ecosystem hasn’t been affected for millennia, as the tallest trees in Europe are to be found there, among firs reaching 50 m high and oaks of 40 m high.
[gravityform id="1" title="true" description="true"]
[gravityform id="2" title="true" description="true"]
Logset launched two large-size harvesters (video)

Logset launched two new harvester models to the 8-wheeled GTE range, 10H GTE and 12H GTE Hybrid. The new models are the biggest harvesters ever built at Logset. As the company describes them, the new harvesters are designed for economical harvesting of large forest areas and efficient processing of big timber volumes.
“Trees are growing, so are we”, says export sales director Pascal Réty. “Since the launch of the first eight-wheeler, more than 50 per cent of our sold harvesters are eight-wheelers. The demand for bigger forest machines is obviously growing. The new reliable and powerful models serve our customers worldwide in all demanding conditions.”
Logset 10H GTE
The 8-wheels provide excellent stability on steep terrain. The big 750/26.5 tires have superior flotation capacity. The machine is equipped with a Mesera 280 crane and Agco Power 7.4 l engine with 300 hp. The 10H GTE (in the photo above) meets now all the requirements needed to handle bigger trees on difficult steep terrains, as Logset describes its harvester.
Logset 12H GTE Hybrid
Logset says that 12H GTE Hybrid features technology that is revolutionary in the forest machine  industry. The electrical energy in the hybrid system supports the Agco Power 7.4 l engine by offering an extra power boost. A huge torque of 2,000 Nm is available at normal working revs. The combination of the engine and the hybrid system can provide up to 520 hp (382kW). Moreover, as a standard the operator can enjoy high lifting capacity of the Mesera 285 crane. The big 780/28.5 wheels increase the ground clearance, offering excellent stability and driving comfort. The machine is fitted with double 210 cc hydraulic work pumps.
Logset Hybrid System
“We have studied hybrid technology for several years already. The technology has developed strongly and is now ready to be implemented into forest machines. Logset hybrid is designed to offer instantaneous power for superior efficiency. It´s a powerful solution but also an economical and ecological choice,” says technical director Jukka Kivipelto.
The fuel consumption is decreased by approximately 25 per cent compared to a similar diesel engine application.
The above descriptions of the harvesters are Logset's own descriptions.
The new harvesters in action:
[gravityform id="1" title="true" description="true"]
[gravityform id="2" title="true" description="true"]
Average prices for Chinese sawn softwood/hardwood imports in 2015

Data from China Customs shows that there was a slight rise in Chinese sawnwood imports in 2015. China’s 2015 sawnwood imports totalled 26.08 million cubic metres valued at US$7 billion, a year on year increase of 2% in volume but an 8% decline in value.
The average price for imported sawnwood was US$285 per cubic metre, down 10% in 2015. Of total sawnwood imports, sawn softwood imports fell 3% to 14.11 million cubic metres, accounting for 54% of the national total. The average price for imported sawn softwood was US$196 per cubic metre, down 10% year on year.
However, the data shows a 7% rise in sawn hardwood imports to 11.97 million cubic metres.The average price for imported sawn hardwoods was US$389 per cubic metre, down 12% year on year.
Of total sawn hardwood imports, tropical sawnwood imports were 4.77 million cubic metres valued at US$2.1 billion, up 15% in volume but down 6% in value and accounted for 18% of the national total. The average price for imported tropical sawnwood was US$432 per cubic metre, a year on year decline of 19%.
Average sawn softwood prices, 2015
| Average price US$/m3 | Change in % 2014/2015 | |
| Russia | 181 | -6% |
| Canada | 190 | -13% |
| Chile | 257 | -7% |
| Finland | 255 | -9% |
| Sweden | 246 | -8% |
| New Zealand | 237 | -23% |
| Germany | 259 | -2% |
| US | 199 | -12% |
| Australia | 207 | -15% |
| Latvia | 265 | -2% |
Data source: China Customs
Sawn softwood sources, 2015
| 2015 imports m3 | Change in % 2014/2015 | |
| Russia | 7,310,000 | 16% |
| Canada | 4,260,000 | -20% |
| Chile | 680,000 | -20% |
| Finland | 540,000 | 48% |
| Sweden | 440,000 | 10% |
| New Zealand | 440,000 | 19% |
| Germany | 160,000 | -36% |
| US | 70,000 | -65% |
| Australia | 30,000 | -54% |
| Latvia | 30,000 | -46% |
Data source: China Customs
Sawn hardwood imports
Average sawn hardwood prices, 2015
| Average price US$/m3 | Change in % 2014/2015 | |
| Thailand | 338 | -26% |
| US | 502 | -7% |
| Russia | 220 | -1% |
| Canada | 235 | -9% |
| Gabon | 645 | -2% |
| Philippines | 148 | -5% |
| Indonesia | 769 | -7% |
| Russia | 496 | -16% |
| Romania | 377 | -1% |
| Vietnam | 380 | -21% |
Data source: China Customs
Sawn hardwood sources, 2015
| 2015 imports/m3 | Change in % 2014/2015 | |
| Thailand | 3,050,000 | 37% |
| US | 2,670,000 | 2% |
| Russia | 1,980,000 | 25% |
| Canada | 1,120,000 | -14% |
| Gabon | 340,000 | 41% |
| Philippines | 320,000 | -46% |
| Indonesia | 250,000 | -12% |
| Russia | 250,000 | 0% |
| Romania | 220,000 | -2% |
| Vietnam | 20,000 | 2% |
Data source: China Customs
[gravityform id="1" title="true" description="true"]
[gravityform id="2" title="true" description="true"]
Peru: Sawnwood exports fall on low deliveries to China
2015 export data released by Peru's Association of Exporters (ADEX) shows that at US$151.31 million (FOB) there was an 11.5% decline in Peruvian wood product exports as compared to 2014. Much of the decline, says ADEX, was the result of a drop in sawnwood exports.
The top Peru export products were mouldings, strips and friezes, accounting for around 32% of the total. However, 2015 exports of these items were down almost 3% from a year earlier.
Peru's sawnwood exports came in as the second ranked item in terms of value and accounted for 19% of exports. There was a 40% drop in exports of sawnwood to China in 2015 compared to 2014. Despite purchasing less sawnwood, China remained the main market for wood products from Peru in 2015.
Peru's exports to the Dominican Republic were encouraging in 2015 as was the level of exports to Mexico which was the main market for sawnwood. The export of semi-manufactured wood in 2015 totalled US$70.84 million FOB with China accounting for most at almost 70% of all exports of this category of product.
Peruvian exports of veneer and plywood in 2015 were worth US$15.29 million FOB, down almost 9% on 2014. The main export markets were Mexico and the United States but imports by Mexico were down over 7%.
Exports of furniture and parts were valued at US$6.72 million FOB in 2015, falling 14% compared to a year earlier. The US was the main market for Peru’s furniture and accounted for over 57% of all wooden furniture exports. The second main market was Italy which accounted for 15% of all furniture exports.
[gravityform id="1" title="true" description="true"]
[gravityform id="2" title="true" description="true"]
Global biomass pellet market expected to rise sharply by 2020

The global biomass pellet market was valued at $6.9 billion (€6.17bn) in 2014 and it is expected to grow with a CAGR of 11.1% during the 2015-2020 period, a study published by P&S Market Research says.
The increased level of investments in the biomass industry has propelled the technological advancement, and there has been a recent upsurge worldwide in co-firing of biomass with coal, since it is a carbon neutral fuel, which helps to reduce emissions from thermal power plants.
The increased demand for the adoption of biomass-based power generation, along with traditional methods of power generation using fossil fuels is responsible for fuelling the growth of the global biomass pellets market.
Europe accounted for the largest share of the global biomass pellet market with 18.14 billion tonnes consumed in 2014.
The major reasons behind growth of the market in the region were low greenhouse gas emission from biomass and increased government initiatives for renewable technologies.
The market in Europe is expected to maintain its growth rate, mainly driven by various subsidies and legislation.
The power sector application segment is expected to witness the fastest growth (12.4% CAGR) during 2015-2020 in the global market.
Based on application, the heat sector segment held the largest market size, with approximately 14.5 billion tonnes volume in 2014, and it is expected to reach 27.5 million tonnes by 2020, growing with a CAGR of 8.7% during the period 2015-2020.
In 2014, North America accounted for the second largest share in the global biomass pellet market, in terms of value and volume.
The major reasons behind growth of the market in the region were increasing demand of biomass pellets in industrial sector, strict environmental regulations, and increasing concern for global warming.
Therefore, the high rate of depletion of fossil fuels and increasing demand for the reduction of greenhouse gases are indirectly creating ample opportunities for the growth of the North American market.
The increased level of investments in the biomass industry has propelled the technological advancement, and there has been a recent upsurge worldwide in co-firing of biomass with coal, since it is a carbon neutral fuel, which helps to reduce emissions from thermal power plants.
The increased demand for the adoption of biomass-based power generation, along with traditional methods of power generation using fossil fuels is responsible for fuelling the growth of the global biomass pellets market.
Europe accounted for the largest share of the global biomass pellet market with 18.14 billion tonnes consumed in 2014.
The major reasons behind growth of the market in the region were low greenhouse gas emission from biomass and increased government initiatives for renewable technologies.
The market in Europe is expected to maintain its growth rate, mainly driven by various subsidies and legislation.
The power sector application segment is expected to witness the fastest growth (12.4% CAGR) during 2015-2020 in the global market.
Based on application, the heat sector segment held the largest market size, with approximately 14.5 billion tonnes volume in 2014, and it is expected to reach 27.5 million tonnes by 2020, growing with a CAGR of 8.7% during the period 2015-2020.
In 2014, North America accounted for the second largest share in the global biomass pellet market, in terms of value and volume.
The major reasons behind growth of the market in the region were increasing demand of biomass pellets in industrial sector, strict environmental regulations, and increasing concern for global warming.
Therefore, the high rate of depletion of fossil fuels and increasing demand for the reduction of greenhouse gases are indirectly creating ample opportunities for the growth of the North American market.
[gravityform id="1" title="true" description="true"]
[gravityform id="2" title="true" description="true"]
The Austrian sawmill industry in 2015

In 2015, Austria’s wood processing companies were able to compensate for the previous year’s losses with a sales increase of 5.5 percent. Sales revenue increased to EUR 8.1 billion. The export success of the Austrian sawmill industry and the manufacturers of timber products made a significant contribution to sales growth in this regard, as shown by the latest sector report on wood processing, compiled by Bank Austria. In 2015, Austria's exports of sawn timber increased nominally by 5.1 percent and timber product exports rose by 4.4 percent, while the export of wood panels stagnated.
Despite sales increases, production capacity in the sector was not fully utilised, and in 2015 companies cut jobs for the third consecutive year as a result. The wood processing industry lost 700 jobs from a total of 28,000 (2.4 percent), including 600 in the manufacturing of wooden components – the largest single segment in the industry with 13,000 employees. The Austrian sawmill industry reduced its number of employees by 1.3 percent, to 8,800 jobs. Only the employment capacities of wood panel producers and at manufacturers of other wooden goods remained unchanged.
Housing construction set to increase demand for wood in 2016
“The wood processing industry can expect greater increases in demand in 2016. The growing demand for wood products is being driven by domestic investments in housing construction, as well as by the increase in new housing construction in key European markets. Germany, which is the destination of more than 30 percent of domestic timber exports, is the main driver. If only a portion of the building permits registered in Austria at the beginning of 2016 have been implemented in actual projects, new construction activity throughout the year is set to increase significantly, and not just with regard to multi-storey residential buildings,” sums up Bank Austria economist Günter Wolf.
In 2013 and 2014, an average of 63,000 new housing construction or housing renovation projects were approved in Austria each year; about as many as during the housing boom years in the mid-1990s. This figure was even higher in 2015.
Low innovation potential threatens competitiveness of Austrian wood processing industry
“The Austrian wood processing industry is competitive in many sectors, as evidenced by the more than two decades of almost continuous growth in timber export surpluses. Nevertheless, in 2015 a further increase of EUR 1.5 billion was recorded, which was attributable to the wood panel and timber sectors in roughly equal measure. These foreign trade successes were based on high productivity gains, made possible by restructuring measures, coupled with high capital expenditure – particularly in the growth-heavy new millennium,” explains Wolf.
Between 2004 and 2008, an average of a further EUR 400 million was invested in wood processing. In the last five years, however, investment spending has fallen to below EUR 200 million per year. At the same time, some productivity gains have been lost and it has been years since the external trade balance improved more than a little; the 2007 record is no longer achievable.
Last but not least, price pressure has increased in the highly processed wood products segment too (in particular parquet flooring and joinery).
“Essentially, wood processors are suffering because of their relatively narrow options to set prices. Processors are able to increase wood prices only with a considerable delay, or only occasionally when it comes to sales prices. For example, producer prices barely changed between 2011 and 2014, while log prices increased by more than 10 percent. This slow price development is attributable primarily to the highly competitive environment, but is also the result of the relatively low innovation potential of wood processors,” Wolf concludes.
Only 40 percent of wood processing plants in Austria are innovative in the sense of the EU Innovation Scoreboards. This is one of the lowest figures for all industry sectors, and is below the average result of the EU-15 for wood processing of 49 percent.
Encouraging, yet limited, growth prospects
In the long term, wood will grow both as an energy source and as a construction material, albeit at a slower pace. Relatively narrow limits have been set in particular for the further efficient expansion of the biomass fraction of energy generation in Austria, since additional timber production is becoming increasingly difficult in light of the high levels of wood utilisation. Since 1998, the share of timber constructions in Austria has increased from 25 percent to 43 percent with regard to the number of buildings, and to 48 percent in housing construction. This share is set to continue growing, at least gradually. Austria already consumes around 0.8 cubic metres of sawmill products and wood panels per resident; this is roughly the same as Finland and Sweden, the record holders for European consumption, and far more than the EU average of 0.3 cubic metres per inhabitant.
European wood processors benefit from the fact that there is still sufficient untapped demand potential in many countries. Even countries with relatively low wood consumption – in Western Europe these include the United Kingdom, Italy and Spain – will probably never catch up to the Austrian level, either because they have no significant wood reserves and/or no tradition of timber construction and no competitive timber industry.
Stronger consumption growth is still expected in Central and Eastern Europe, especially in countries with high wood reserves such as Romania and Russia. In other words, the expected demand for wood products in Austria will continue to be covered mainly from domestic production; in the long term, however, the industry will lose some of its export share as further production capacities are developing in countries with low consumption figures and large wood reserves.
In the Austrian sawmill industry, investments decreased in relation to gross value added from 25 percent in 2008 to 15 percent in 2013 – by comparison, in Romania, these fell from 83 percent to 52 percent over the same period.
Highlights of the Austrian sawmill industry in 2015:
- Economic recovery in 2015: industry sales rise nominally by 5.5 percent to EUR 8.1 billion
- However, capacity utilisation in 2015 was too low to stop employment reduction: number of jobs drops by 2.4 percent
- Increase in new housing construction results in greater demand for wood products in 2016
- Low innovation potential threatens competitiveness of Austrian wood processing industry
- Wood set to become an even more important raw material in the long term, but at a slower pace and with limited increases in consumption
[gravityform id="1" title="true" description="true"]
[gravityform id="2" title="true" description="true"]
Lumber prices in US gain ground at the end of March

A slower pace of sales was widely noted in the US lumber market of last week, but strength in prices of framing lumber prevailed. The gains mostly came early in the week on momentum carried over from the previous week. Many traders paused to digest recent purchases and higher prices. That approach was abetted by the Montreal Wood Convention and spring break, which took many traders out of their offices. Easter observances were an additional factor late in the week. The Random Lengths Framing Lumber Composite Price rose for an eighth straight week.
| This Week Mar 25 |
Last Week Mar 18 |
Year Ago 2015 |
|
| Random Lengths Framing Lumber Composite Price* | $340 | $332 | $333 |
| KD Western S-P-F #2&Btr 2x4 R/L Mill Price | 303 | 299 | 276 |
| KD Eastern S-P-F #1&2 2x4 R/L, delivered Great Lakes | 378 | 375 | 381 |
| Green Douglas Fir Std&Btr 2x4 R/L (Portland) | 332 | 328 | 298 |
| Southern Pine (Westside) #2 2x4 R/L | 387 | 381 | 395 |
| KD Coast Hem-Fir #2&Btr 2x4 R/L | 352 | 337 | 310 |
| Ponderosa Pine (Inland) #2&Btr 1x12 R/L | 675 | 675 | 670 |
| * Weighted average of 15 key items | |||
Random Lengths Panel Market Report
Firm to higher prices were evident in structural panel markets. Western Fir plywood recorded the largest price jumps, with some items posting double-digit increases. A moderate surge of orders Wednesday and Thursday solidified mills’ positions and gave them the impetus to bump prices higher. Sales tapered in all markets due to Good Friday observances. OSB prices posted $3-8 increases in all producing zones. Most of the sharpest increases were seen in the West. Modest increases were posted in Southern Pine plywood.
| (f.o.b. mill prices) | This Week Mar 25 |
Last Week Mar 18 |
Year Ago 2015 |
| Random Lengths Structural Panel Composite Price* | $354 | $350 | $376 |
| Southern (west-east) 15/32-inch 3-ply rated sheathing plywood | 373-397 | 370-397 | 442-500 |
| Southern (west-east) 15/32-inch 4-ply rated sheathing plywood | 375-400 | 375-400 | 447-508 |
| Western 1/2-inch 4-ply rated sheathing plywood | 358 | 340 | 427 |
| North Central 7/16-inch Oriented Strand Board | 225 | 220 | 183 |
| *Weighted average of 11 key items | |||
[gravityform id="1" title="true" description="true"]
[gravityform id="2" title="true" description="true"]
Top 20 lumber producers in US & Canada in 2015

In 2015, total Canadian softwood lumber shipments grew by 9.2% to 26.5 billion bf and U.S. production saw smaller gains, or +1.9% to 32.0 billion bf.
The 20 most important Canadian companies increased production in 2015 (+3.6%), but it was not sufficient to keep paced with the rest of the industry as a result their market share of total Canadian lumber shipments slipped to 74% in 2015 from 80% in 2014.
According to Wood Markets, the decline in market share is clearly an indication of the large Canadian companies consolidating production and retooling mills in anticipation of changes in the log profile and projected tightening or outright reductions in the overall timber supply.
“However,” said Peter Butzelaar, Vice President of Wood Markets,“ the U.S. South is proving to be a strategic pivot option for Canadian producers looking to raise their production and diversify their market and product mix.”
The key attraction to investing in the U.S. South is the region’s more readily available and affordable timber supply with close market proximity. The most active “acquiring” Canadian companies in 2015 were Interfor and Canfor: Interfor increased its U.S. South mill count by three to nine mills, and Canfor added six mills to lift its count in the South to ten. West Fraser, on the other hand, added no new mills in 2015, but did reap benefits from the completion of several capital upgrades in 2014.
The top 5 Canadian producers were Canfor, West Fraser, Tolko, Resolute and Western Forest Products, with the only change in the order from 2014 being Western moving ahead of Interfor.
Canfor retained its lead spot in Canada, increasing its output through capital upgrades by 2.5% to 3.83 billion bf. Maintaining its close second position was West Fraser at 3.60 billion bf (+3.5%) carried higher by a number of capital expansion projects completed in 2014 and the acquisition of the Manning Diversified sawmill in Alberta in 2015. Tolko placed third, with its output rising by 3.9%, this despite cutting production by half at its Quesnel, B.C. mill beginning in late 2015.
On fourth-place, Resolute grew by 5.9% to 1.68 billion bf with the gains primarily coming from the addition of two Ontario sawmills coming online in 2015. Western Forest Products saw its output contract by -1.9% to 891 million bf due to disruptions related to capex upgrades at multiple sawmills in 2015. Interfor’s drop in 2015 production -16.9% to 784 million bf is attributed to a combination of market-related downtime taken by its various Canadian mills as well and the curtailment of the Castlegar mill while it completed a major mill upgrade.
According to Wood Markets, the total lumber shipments of the 20 most important US companies rose by 8.0% to 19.7 billion bf in 2015. This is only the second year in which the collective output of the U.S. top 20 surpassed that of the top 20 Canadian producers. Together, the 20 most important US companies produced 61.5% of all American softwood lumber shipments in 2015, versus 58.0% in 2014. This growth indicates that the largest U.S. producers (including Canadian firms) are continuing with their investment strategies aimed at meeting the anticipated rising demand of the U.S. housing market.
Similar to Canada, the order of the top four companies in the U.S. in 2015 remained unchanged. Weyerhaeuser retained its first-place position increasing by 3.1% to 3.41 billion. Georgia-Pacific remained second, growing by 3.5%. In third place was Sierra Pacific, which grew its production by 4.1% as a result of the rebuilt Quincy mill operating for the full year.
West Fraser stayed in fourth spot, with production up 10.5% to 2 billion bf, reflecting the full-year operation of the two Arkansas sawmills acquired in the first half of 2014, along with operational efficiency improvements. Interfor moved into fifth place with production of 1.7 billion bf — an increase of 38.4% that resulted from additional production generated by two mills acquired from Simpson and one from Price. Although Canfor placed seventh (behind Hampton), it deserves special mention given that its production doubled from 2014 to 1.2 billion bf in 2015 — via a series of acquisitions that raised the former’s mill total from nine to thirteen in the U.S. South.
The top five U.S. firms produced 36.0% (11.5 billion bf) of all U.S. lumber shipments — up from 33.7% in 2014 — while their Canadian counterparts produced 47.8% (11.6 billion bf, down from 45.2% in 2014).
For 2016 the greatest wildcard will be the outcome of ongoing negotiations for the next Softwood Lumber Agreement (SLA). This will be the greatest unknown that the Canadian industry will have to deal with, as a punitive agreement (which can only be expected given the apparent American resolve) will not be good news.
| CANADA TOP SOFTWOOD LUMBER PRODUCERS IN 2015 (Million BF) |
|||||||
| Rank | Company | No. of Mills | Production | % Change | |||
| 2014 | 2015 | 2014 | 2015 | ||||
| 1 | 1 | Canfor | 12 | 3,735 | 3,829 | 2.5% | |
| 2 | 2 | West Fraser | 13 | 3,476 | 3,599 | 3.5% | |
| 3 | 3 | Tolko | 8 | 1,886 | 1,960 | 3.9% | |
| 4 | 4 | Resolute FP | 15 | 1,585 | 1,678 | 5.9% | |
| 6 | 5 | Western FP1 | 8 | 908 | 891 | -1.9% | |
| Total Top 5 | 56 | 11,590 | 11,957 | 3.2% | |||
| Total Top 20 | 104 | 18,877 | 19,566 | 3.6% | |||
| Total Canada | 24,226 | 26,458 | 9.2% | ||||
| Total 5 as a % of Canada Shipments | 47.8% | 45.2% | |||||
| Total 20 as a % of Canada Shipments | 77.9% | 74.0% | |||||
| Notes: Includes lumber produced only at primary sawmills and excludes US production 1 includes custom net volume Source: Wood Markets |
|||||||
| USA TOP SOFTWOOD LUMBER PRODUCERS IN 2015 (Million BF) |
|||||||
| Rank | Company | No. of Mills | Production | % Change | |||
| 2014 | 2015 | 2014 | 2015 | ||||
| 1 | 1 | Weyerhaeuser | 15 | 3,307 | 3,410 | 3.1% | |
| 2 | 2 | Georgia-Pacific* | 17 | 2,266 | 2,345 | 3.5% | |
| 3 | 3 | Sierra Pacific | 12 | 1,951 | 2,031 | 4.1% | |
| 4 | 4 | West Fraser | 15 | 1,817 | 2,008 | 10.5% | |
| 6 | 5 | Interfor | 13 | 1,238 | 1,713 | 38.4% | |
| Total Top 5 | 72 | 10,579 | 11,507 | 8.8% | |||
| Total Top 20 | 131 | 18,225 | 19,691 | 8.0% | |||
| Total Canada | 31,408 | 31,998 | 1.9% | ||||
| Total 5 as a % of Canada Shipments | 33.7% | 36.0% | |||||
| Total 20 as a % of Canada Shipments | 58.0% | 61.5% | |||||
| Notes: Includes lumber produced only at primary sawmills and excludes all Canada and offshore production. *2015 Estimate Source: Wood Markets |
|||||||
[gravityform id="1" title="true" description="true"]
[gravityform id="2" title="true" description="true"]
Top 20 lumber producers in US & Canada in 2015
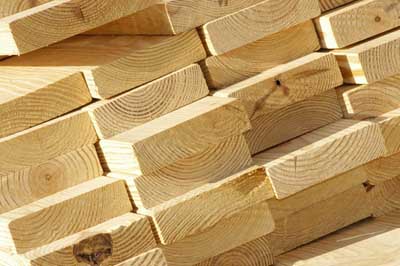
In 2015, total Canadian softwood lumber shipments grew by 9.2% to 26.5 billion bf and U.S. production saw smaller gains, or +1.9% to 32.0 billion bf.
The 20 most important Canadian companies increased production in 2015 (+3.6%), but it was not sufficient to keep paced with the rest of the industry as a result their market share of total Canadian lumber shipments slipped to 74% in 2015 from 80% in 2014.
According to Wood Markets, the decline in market share is clearly an indication of the large Canadian companies consolidating production and retooling mills in anticipation of changes in the log profile and projected tightening or outright reductions in the overall timber supply.
“However,” said Peter Butzelaar, Vice President of Wood Markets,“ the U.S. South is proving to be a strategic pivot option for Canadian producers looking to raise their production and diversify their market and product mix.”
The key attraction to investing in the U.S. South is the region’s more readily available and affordable timber supply with close market proximity. The most active “acquiring” Canadian companies in 2015 were Interfor and Canfor: Interfor increased its U.S. South mill count by three to nine mills, and Canfor added six mills to lift its count in the South to ten. West Fraser, on the other hand, added no new mills in 2015, but did reap benefits from the completion of several capital upgrades in 2014.
The top 5 Canadian producers were Canfor, West Fraser, Tolko, Resolute and Western Forest Products, with the only change in the order from 2014 being Western moving ahead of Interfor.
Canfor retained its lead spot in Canada, increasing its output through capital upgrades by 2.5% to 3.83 billion bf. Maintaining its close second position was West Fraser at 3.60 billion bf (+3.5%) carried higher by a number of capital expansion projects completed in 2014 and the acquisition of the Manning Diversified sawmill in Alberta in 2015. Tolko placed third, with its output rising by 3.9%, this despite cutting production by half at its Quesnel, B.C. mill beginning in late 2015.
On fourth-place, Resolute grew by 5.9% to 1.68 billion bf with the gains primarily coming from the addition of two Ontario sawmills coming online in 2015. Western Forest Products saw its output contract by -1.9% to 891 million bf due to disruptions related to capex upgrades at multiple sawmills in 2015. Interfor’s drop in 2015 production -16.9% to 784 million bf is attributed to a combination of market-related downtime taken by its various Canadian mills as well and the curtailment of the Castlegar mill while it completed a major mill upgrade.
According to Wood Markets, the total lumber shipments of the 20 most important US companies rose by 8.0% to 19.7 billion bf in 2015. This is only the second year in which the collective output of the U.S. top 20 surpassed that of the top 20 Canadian producers. Together, the 20 most important US companies produced 61.5% of all American softwood lumber shipments in 2015, versus 58.0% in 2014. This growth indicates that the largest U.S. producers (including Canadian firms) are continuing with their investment strategies aimed at meeting the anticipated rising demand of the U.S. housing market.
Similar to Canada, the order of the top four companies in the U.S. in 2015 remained unchanged. Weyerhaeuser retained its first-place position increasing by 3.1% to 3.41 billion. Georgia-Pacific remained second, growing by 3.5%. In third place was Sierra Pacific, which grew its production by 4.1% as a result of the rebuilt Quincy mill operating for the full year.
West Fraser stayed in fourth spot, with production up 10.5% to 2 billion bf, reflecting the full-year operation of the two Arkansas sawmills acquired in the first half of 2014, along with operational efficiency improvements. Interfor moved into fifth place with production of 1.7 billion bf — an increase of 38.4% that resulted from additional production generated by two mills acquired from Simpson and one from Price. Although Canfor placed seventh (behind Hampton), it deserves special mention given that its production doubled from 2014 to 1.2 billion bf in 2015 — via a series of acquisitions that raised the former’s mill total from nine to thirteen in the U.S. South.
The top five U.S. firms produced 36.0% (11.5 billion bf) of all U.S. lumber shipments — up from 33.7% in 2014 — while their Canadian counterparts produced 47.8% (11.6 billion bf, down from 45.2% in 2014).
For 2016 the greatest wildcard will be the outcome of ongoing negotiations for the next Softwood Lumber Agreement (SLA). This will be the greatest unknown that the Canadian industry will have to deal with, as a punitive agreement (which can only be expected given the apparent American resolve) will not be good news.
| CANADA TOP SOFTWOOD LUMBER PRODUCERS IN 2015
(Million BF) |
|||||||
| Rank | Company | No. of Mills | Production | % Change | |||
| 2014 | 2015 | 2014 | 2015 | ||||
| 1 | 1 | Canfor | 12 | 3,735 | 3,829 | 2.5% | |
| 2 | 2 | West Fraser | 13 | 3,476 | 3,599 | 3.5% | |
| 3 | 3 | Tolko | 8 | 1,886 | 1,960 | 3.9% | |
| 4 | 4 | Resolute FP | 15 | 1,585 | 1,678 | 5.9% | |
| 6 | 5 | Western FP1 | 8 | 908 | 891 | -1.9% | |
| Total Top 5 | 56 | 11,590 | 11,957 | 3.2% | |||
| Total Top 20 | 104 | 18,877 | 19,566 | 3.6% | |||
| Total Canada | 24,226 | 26,458 | 9.2% | ||||
| Total 5 as a % of Canada Shipments | 47.8% | 45.2% | |||||
| Total 20 as a % of Canada Shipments | 77.9% | 74.0% | |||||
| Notes: Includes lumber produced only at primary sawmills and excludes US production
1 includes custom net volume Source: Wood Markets |
|||||||
| USA TOP SOFTWOOD LUMBER PRODUCERS IN 2015
(Million BF) |
|||||||
| Rank | Company | No. of Mills | Production | % Change | |||
| 2014 | 2015 | 2014 | 2015 | ||||
| 1 | 1 | Weyerhaeuser | 15 | 3,307 | 3,410 | 3.1% | |
| 2 | 2 | Georgia-Pacific* | 17 | 2,266 | 2,345 | 3.5% | |
| 3 | 3 | Sierra Pacific | 12 | 1,951 | 2,031 | 4.1% | |
| 4 | 4 | West Fraser | 15 | 1,817 | 2,008 | 10.5% | |
| 6 | 5 | Interfor | 13 | 1,238 | 1,713 | 38.4% | |
| Total Top 5 | 72 | 10,579 | 11,507 | 8.8% | |||
| Total Top 20 | 131 | 18,225 | 19,691 | 8.0% | |||
| Total Canada | 31,408 | 31,998 | 1.9% | ||||
| Total 5 as a % of Canada Shipments | 33.7% | 36.0% | |||||
| Total 20 as a % of Canada Shipments | 58.0% | 61.5% | |||||
| Notes: Includes lumber produced only at primary sawmills and excludes all Canada and offshore production.
*2015 Estimate Source: Wood Markets |
|||||||
[gravityform id="1" title="true" description="true"]
[gravityform id="2" title="true" description="true"]
Estonia: Roundwood prices in January 2016
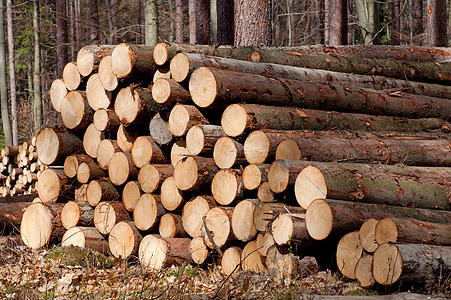
The January 2016 prices for roundwood in Estonia are largely lower as compared to the same month of last year. Of the sawlog assortments, only the price for small diameter spruce is higher than in January 2015. The largest price decrease was recorded for small diameter pine (-6.31%). Birch plywood has dropped yoy by -4.53%.
For industrial timber, there are some uneven price developments. While spruce and birch pulpwood are cheaper than a year ago, pine and aspen pulpwood are more expensive, with the latter by more than 25%.
The prices for firewood and wood chips are higher over January 2015 by almost 4% and 6% respectively.
On contrast, Estonian roundwood prices are clearly on an upward trend when compared to December 2015. Except birch, aspen sawlogs, and birch pulpwood, all prices have increased. Again, aspen pulpwood tops with a 16% price increase, followed by spruce sawlogs and pine pulpwood.
Roadside prices of roundwood in state forests of Estonia (u.b.) |
January 2015 €/m3 | December 2015 €/m3 | January 2016 €/m3 | Change% January 2015 to January 2016 |
| Pine sawlogs | 67,84 | 64,16 | 65,44 | -3,54% |
| Pine diameter<18cm | 57,24 | 52,18 | 53,63 | -6,31% |
| Spruce | 64,44 | 60,43 | 63,58 | -1,33% |
| Spruce diameter <18cm | 48,83 | 46,32 | 49,81 | 2,01% |
| Birch veneer | 101,35 | 95,85 | 96,76 | -4,53% |
| Birch sawlogs | 60,10 | 57,61 | 56,66 | -5,72% |
| Aspen | 32,90 | 32,00 | 31,11 | -5,44% |
| Pine pulpwood | 24,04 | 22,88 | 24,53 | 2,04% |
| Spruce pulpwood | 24,60 | 23,36 | 24,53 | -0,28% |
| Birch pulpwood | 26,93 | 25,88 | 25,59 | -4,98% |
| Aspen pulpwood | 17,95 | 19,34 | 22,50 | 25,35% |
| Firewood | 19,94 | 19,44 | 20,69 | 3,76% |
| Wood chips | 28,10 | 28,19 | 29,84 | 6,19% |
[gravityform id="1" title="true" description="true"]
[gravityform id="2" title="true" description="true"]
Swedish Martinsons seeks new standard for even taller buildings built out of wood
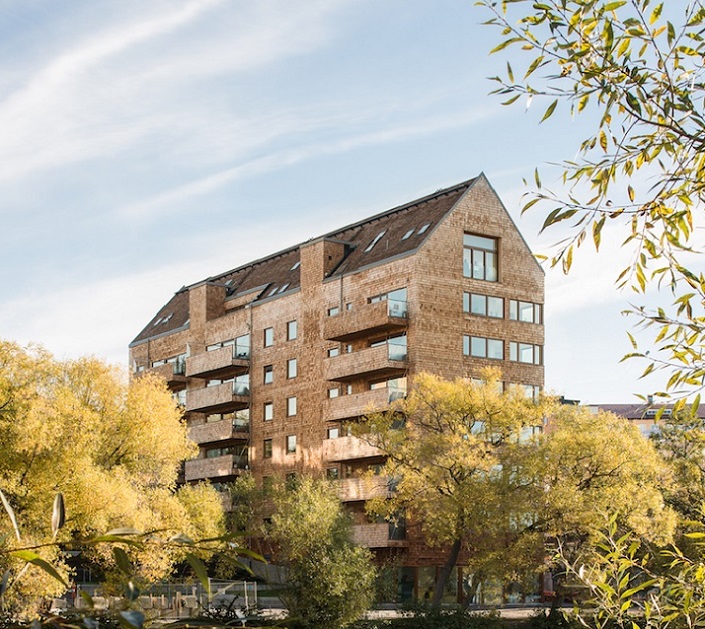
Martinsons wants to develop a new standard that enables even taller buildings to be built using wood.
“When constructing tall buildings, oscillations and vibrations are calculated in order to determine how high you can build. However, the current building standard does not take into account the fact that wood behaves differently to steel and concrete. The result is unnecessary height restrictions for wooden buildings. We therefore need a building standard that also includes wood as a material,” says Greger Lindgren, Technical Manager at Martinsons.
Martinsons launched the first part of the Tall Buildings project in autumn 2015. This involved measuring vibrations and the damping capacity at roof level at Strandparken in Sundbyberg (Sweden), among other places.
With eight floors, Strandparken (in the pictures) is currently Sweden’s tallest residential building
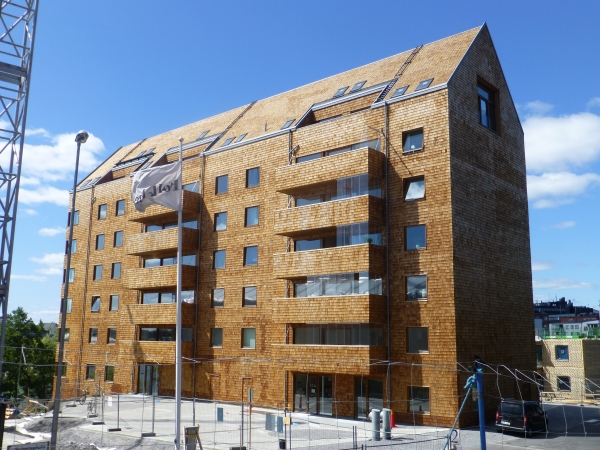
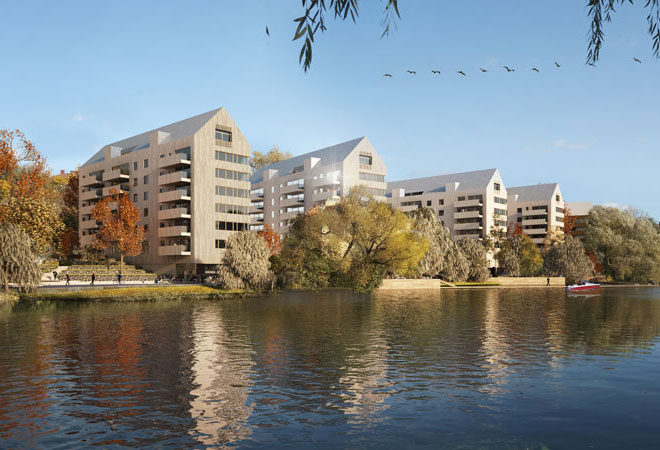
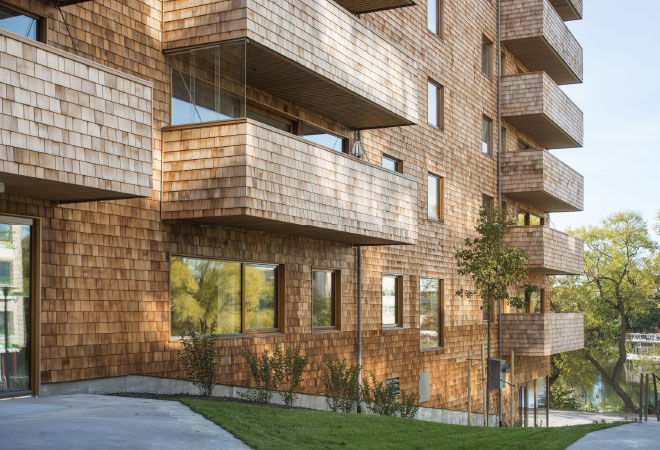
constructed from wood. With support from Vinnova and Swedish Wood (Svenskt Trä), the project is now moving forward, with the aim being to produce documentation for a new building standard that also includes wood.
The surveys conducted during the first part of the Tall Buildings project aimed to establish how accurate Martinsons’ own calculations are.
“Our surveys show that the building standard we currently follow does not reflect reality, because it was developed with other materials in mind. The calculation methods set out in the standard quite simply cannot be applied to a lightweight material like wood,” continues Greger Lindgren.
The second part of the Tall Buildings project is intended to make a substantial contribution to the development of a new standard that is also suitable for wooden buildings. The current standard makes it problematic to construct wooden buildings with more than eight to ten floors. Greger believes that a standard that takes into account the properties of wood could enable buildings with up to fifteen floors to be constructed.
“It’s not an easy job, however. We have to be able to provide evidence of the issues we encounter in the existing calculation models,” says Greger.
The project will run for three years and will commence during the spring.
[gravityform id="1" title="true" description="true"]
[gravityform id="2" title="true" description="true"]
Sweden: Forest machines market is falling
The Swedish market for forest machines is shrinking. That’s the conclusion of a review of the past six years’ registrations of forwarders. The average reduction is 16 percent.
The manufacturers can see several reasons and the trend also applies to harvesters.
“The machines are becoming more efficient, with a higher utilisation rate and longer lifespan,” explains Rolf Andersson, CEO of Rottne. “Because the felling volumes stay relatively constant from year to year, fewer machines are required.”
The trend is also apparent in the after market. Previously it was common to do welding repairs on frames and centre pivots. But stronger constructions now mean that welding is rarely done whatever the brand of machine.
Other factors are also at work. Peter Hasselryd, CEO of Komatsu Forest, says the proportion of final felling done has been unusually high.
“We’ve sold fewer but larger machines,” he says, pointing to upcoming production increases at the Södra Värö and SCA Ortviken pulp mills. “The forestry companies may have temporarily reduced their thinning operations in order to save their thinner stock until the new mills come on line.”
Higher demands from the banks
A third explanation is that the banks are making greater demands for financing forest machines and contractors are therefore delaying replacing their machines.
“This is fundamentally a sound development that can give contractors a stronger economic situation,” says Martin Bredenfeldt, CEO of Gremo.
New registrations of forwarders in Sweden fell by five percent in 2015, from 301 to 287 machines. John Deere retook first place with 127 registered forwarders, a market share of 44.3 percent.
“We were right in the middle of changing our product range in 2014 and had eight months’ delivery time for some models,” explains Dieter Reinisch of John Deere. “Now the new models are in place and the statistics are showing that.”
Komatsu Forest was the top selling brand in Sweden in 2014. Last year the company fell back from 101 to 85 forwarders sold. The move does not worry Peter Hasselryd.
“2014 was a good year with successful launches of new models,” he says. “Over time we’ve had a 30-percent market share and that’s where we are now.”
Gremo was among those that lost the most. According to the official statistics four Gremo forwarders were registered in 2015. The company says it sold seven machines but even that is nearly a 50-percent reduction compared with 2014’s sale of 12 machines.
“We’ve cut back on our operations and have reached our planned level,” Martin Bredenfeldt says. “Seventy to seventy-five percent of our production goes to export, mainly within Europe.”
Big growth for small machines
Another explanation for the shrinking market could be the successes of small professional machines, which are not registered with the Swedish Transport Agency. But the manufacturers say this competition has a marginal effect.
“We’re feeling this impact mostly on our smallest model among the independent larger private forest owners,” says Rolf Andersson of Rottne.
During the period 2013 to 2015 an average of 282 forwarders were registered per year. The average for the previous three-year period was 335, meaning that the market has shrunk by 16 percent or 54 forwarders.
|
Number of registered forwarders in Sweden in 2015 by manufacturer |
||||
|
Year |
2015 |
2014 |
||
|
Manufacturer |
Number |
% |
Number |
% |
|
John Deere |
127 |
44.3 |
94 |
31.2 |
|
Komatsu |
85 |
29.6 |
101 |
33.6 |
|
Rottne |
29 |
10.1 |
34 |
11.3 |
|
Ponsse |
26 |
9.1 |
41 |
13.6 |
|
EcoLog |
14 |
4.9 |
11 |
3.7 |
|
Gremo |
5 |
1.7 |
12 |
4.0 |
|
Logset |
1 |
0.3 |
1 |
0.3 |
|
Tigercat |
0 |
0.0 |
7 |
2.3 |
|
Total |
287 |
301 |
||
|
|
||||
Source: the Swedish Transport Agency. Compiled by Elmia AB
|
Number of registered forwarders in Sweden by year |
|||
|
Year |
Number |
||
|
2015 |
287 |
||
|
2014 |
301 |
||
|
2013 |
257 |
||
|
2012 |
335 |
||
|
2011 |
358 |
||
|
2010 |
313 |
||
|
2009 |
258 |
||
|
2008 |
353 |
||
|
2007 |
382 |
||
|
2006 |
299 |
||
|
2005 |
353 |
||
Source: the Swedish Transport Agency. Compiled by Elmia AB
[gravityform id="1" title="true" description="true"]
[gravityform id="2" title="true" description="true"]
Ukraine: Government suggests the Parliament to lift the timber export ban

The Ukrainian Government suggested the Parliament to lift the timber exports ban and to calm the market by introducing timber auctions, according to Interfax Ukraine.
This is outlined in bill No. 4286 registered in parliament on March 22, 2016. An explanatory note attached to the bill says the 10-year moratorium to export timber passed last year is not in line with Ukraine's liabilities under the Ukraine-EU Association Agreement and the conditions for providing international macro-financial assistance to the country, says Interfax.
The bill no. 4286 from March 22 stated that the 10-year moratorium for timber exports expired last year and isn’t in accordance with the liabilities of Ukraine under the Ukraine-EU Association Agreement. Also, it added that the obscure timber market issue should be solved, especially through timber auctions.
The interagency handling the timber exports ban has already drafted the legislative measure. Deputy Economic Development and Trade Minister Natalia Mykolska stated that the document was made together with NGO Better Regulation Delivery Office (BRDO).
Through auctions, the timber would be sold to residents and the timber that wouldn’t be sold would be offered to nonresidents. Thus, residents won’t be able to export the timber they bought at the auctions and which will come from Ukrainian producers.
In November 2015, the logs export ban introduced by the Ukrainian Law Nr. 325-VIII (09.04.2015) entered into force. The law temporarily prohibits (10 years) the exportation outside the customs territory of Ukraine of untreated wood from all tree species (except pine) as of November 1, 2015. The same would apply to pine as well, but later - starting from January 1, 2017.
The legislative draft in question stipulated a temporary ban for the following: unprocessed wood including raw wood, such as roundwood in the form of logs, poles etc. with moisture content exceeding 22% and sawn timber with the thickness exceeding 70 mm and moisture content more than 22%.
[gravityform id="1" title="true" description="true"]
[gravityform id="2" title="true" description="true"]
US West coast logs exports up 5.5% in Q4; lumber exports down on low Chinese demand

The latest data summarizing West coast log and lumber exports in the fourth quarter of 2015 were released on Thursday by the U.S. Forest Service’s Pacific Northwest Research Station.
China decreased its West coast log and lumber imports in 2015 as a result of its domestic economic and national restructuring adjustment, but the country remains the leading market for West coast wood products, Xiaoping Zhou said, a research economist at the station. About 59 percent of the West coast’s log exports and 31 percent of its lumber exports went to China in 2015.
According to Zhou, the percentage of West coast log and lumber exports relative to total U.S. exports has decreased in recent years because more exports are coming from other districts, such as New York City and Norfolk, Virginia.
2015 Fourth Quarter Highlights
Volume of West Coast Log and Lumber Exports, 2015 Q4
|
Current Quarter |
Change Compared to Last Quarter (2015 Q3) |
Change Compared to Last Year (2014 Q4) |
|
|
Logs |
340 MMBF* |
10.9% |
5.5% |
|
Lumber |
155 MMBF* |
2.5% |
-8.8% |
* Million board feet.
Value of West Coast Log and Lumber Exports, 2015 Q4
|
Current Quarter |
Change Compared to Last Quarter (2015 Q3) |
Change Compared to Last Year (2014 Q4) |
|
|
Logs |
$231 million |
8.6% |
-9.6% |
|
Lumber |
$115 million |
2.5% |
-9.7% |
2015 Annual Highlights
Volume of West Coast Log and Lumber Exports in 2015
|
Current Year |
Change Compared to Last Year (2014) |
|
|
Logs |
1,248 MMBF* |
-26.8% |
|
Lumber |
656 MMBF* |
-26.4% |
* Million board feet.
Value of West Coast Log and Lumber Exports in 2015
|
Current Year |
Change Compared to Last Year (2014) |
|
|
Logs |
$884 million |
-32.5% |
|
Lumber |
$489 million |
-25.5% |
[gravityform id="1" title="true" description="true"]
[gravityform id="2" title="true" description="true"]

