

The European Commission released the results of the first review of the EU Timber Regulation (EUTR) on 19 February. The review covers the period from March 2013 to March 2015 and is based on Member States’ reports on the application of the EUTR, an open public consultation, targeted stakeholder surveys and an evaluation report produced by an external consultant. It analyses the EUTR for relevance, effectiveness, efficiency, coherence and EU added value.
On private sector compliance during the first two years of application, the EC found that SMEs were struggling more than larger companies to fulfil EUTR obligations.
According to the review, SMEs consider EUTR compliance “a challenge, due to difficulties in understanding the technical requirements of the due diligence system (DDS), lack of staff with adequate knowledge and experiences necessary for exercising the DDS and/or limited financial resources”.
In order to carry out more cost-effective due diligence, the Commission recommends that operators make more use of voluntary third-party verified schemes in the riskassessment and risk-mitigation process.
It also conceded that the “role of third-party verified schemes in the implementation of the legislation could be further clarified in the Guidance Document” and found that “the main timber certification schemes have adapted their standards to reflect the scope of the legality definition embedded in the Regulation and have emerged as a practical option that can be used by EU operators”.
Private sector compliance “uneven and insufficient”
The analysis of private sector compliance also revealed that “operators have not consistently implemented due diligence requirements” during the reporting period. However, the situation is gradually improving.
One of the main points of criticism identified by Competent Authorities during checks was that there was often a lack of understanding of all elements needed for the due diligence system, so “while many operators had some type of DDS, they did not always meet the EUTR requirements”.
Enlisting the help of a Monitoring Organisation (MO), which provide compliant DDS (Due Dilligence System) may be helpful in many of these cases. However, the review found that operators’ interest in MO services has so far been very low. This was partly attributed to the fact that MOs are obliged to alert the Competent Authorities in cases of major EUTR infringements.
Enlarging the product scope under consideration The product scope of the EUTR – or existing “loopholes” – has been a subject of frequent criticism by media and NGOs. As a result, it was part of the recent stakeholder consultation.
The outcome of the consultation was mixed, according to the Commission; while many stakeholders do not consider the current product scope optimal and wanted to include products like wooden seats, print media, musical instruments and wooden coffins, others believed the scope should not be expanded before the EUTR was fully implemented.
Especially in the case of print media, the Commission concluded that the “variety and complexity of printed good would need to be taken into account when considering enlarging the current product scope”.
[gravityform id="1" title="true" description="true"]
[gravityform id="2" title="true" description="true"]
Article archive
Germany: Producer prices for wood products change uneven

Producer prices for wood products in Germany registered uneven movements in January 2016. The great part of the products became a bit more expenisve as compared to December. About one third have recorded prices drop. Wood chips gained the most in value (+1,52%), while wider boards (above 16 cm width) registered the most significant price drop (-0.99%).
A similar picture can be noticed when compared with the previous year, but with bigger swings. The largest price increase compared to January 2015 can be seen in beech blocks (+2,59%). This is followed by hardwood lumber (+1,17%) and beech frames (+0,98%). Thus, the hardwood lumber products have recorded the largest price increases over the previous year. The most significant price fall can be seen in wood pellets (-8,82%), followed by raw particleboard (-5,91%). The indexes for wood materials, with the exception of decorative particleboard, shows no change.
|
Producer Price Index Commercial Products |
January 2015 |
December |
January 2016 |
Change |
| Spruce and Fir lumber (Picea abies Karst.) |
113,1 |
112,6 |
112,9 |
-0,17% |
| Lumber according to DIN 4074/S10 |
116,5 |
116,5 |
117,1 |
+0,42% |
| Finger-jointed squares and beams (KVH) |
100,5 |
99,3 |
98,6 |
-1,89% |
| Boards, width over 16 cm |
120,9 |
121,8 |
120,6 |
+0,32% |
| Boards, width from 8 to 16 cm, size from 15 to 24 mm |
108,8 |
109,4 |
109,8 |
+0,27% |
| Roof battens according to DIN 4074/S10 |
116,2 |
116,3 |
117,5 |
+1,11% |
| Stock squared timber, A/B, 10X10 - 12X12 |
115,8 |
113,4 |
113,3 |
-2,15% |
| Softwood, size>6mm, planed, sanded, finger-jointed |
111,1 |
110,5 |
110,5 |
-0,54% |
| Wood chips from softwood |
100,3 |
98,5 |
100,0 |
-0,29% |
| Pellets and Briquets, compressed |
121,2 |
110,2 |
110,5 |
-8,82% |
| Hardwood lumber |
110,6 |
111,8 |
111,9 |
+1,17% |
| Beech blocks, A/B, size 50-60 mm, length 3m, damped |
104,2 |
106,6 |
106,9 |
+2,59% |
| Beech frames, size 26-32 mm, length 3m, undamped |
111,3 |
112,4 |
112,4 |
+0,98% |
| Particle boards, raw or sanded |
118,3 |
110,6 |
111,3 |
-5,91% |
| Particle boards, laminated with decor |
115,2 |
115,2 |
115,2 |
0,00% |
| HDF panels, size > 800 kg/m³, raw/sanded |
115,8 |
114,7 |
113,7 |
-1,81% |
| Laminate floorings, density > 800 kg/m³ |
109,3 |
109,0 |
108,8 |
-0,45% |
[gravityform id="1" title="true" description="true"]
[gravityform id="2" title="true" description="true"]
Prices fall while competition increases on the Russian fibreboard and MDF market

The Russian fibreboard and MDF/HDF output got to 2.5 million m3 in 2014. The solid fibreboard and thin MDF/HDF (2-6 mm thick) reached 1.1 million m3 of the total amount. Solid fibreboard and thin MDF/HDF represent 88% of the Russian fiberboard and MDF exports, as WhatWood reported.
27 Russian companies are manufacturing fibreboard and MDF/HDF and 13 of them produce MDF with a joint capacity of 3 million m3 per year. There are another 5 projects that are soon to be implemented and their joint capacity reaches 2 million m3 per year.
At the moment, Kronostar and Kronospan are the largest solid fibreboard and thin MDF/HDF producers in the MDF/HDF segment. Vyatka plywood mill and Lesosibirsky LDK No. 1 hold the same position for the solid fibreboard segment, according to WhatWood.
Exports of the Russian solid fibreboard and thin MDF/HDF reached 148,800 m3 (46.5 million m2) in volume terms and $49 million in value terms in 2014. The importing markets are: Uzbekistan (50%), Tajikistan (17%), Kyrgyzstan (9%), while the largest exporting companies are: Ufimsky FPK (19%, 8.9 million m2), Lesosibirsky LDK No. 1 (16%, 7.6 million m2), Kronospan (14%, 6.4 million m2), Poleko (14%, 6.3 million m2).
Because the furniture industry is responsible for 50% of the fibreboard and MDF/HDF sales, the demand in these materials is linked to the furniture production. Another 20% comes from the construction industry.
During the period of 2014-2015, new enterprises were set in motion, such as Kastamonu Entegre in Tatarstan and PDK Apsheronsk in the Krasnodar Region. Lesplitinvest in the Leningrad Region and Belarusian Bellesbumprom commissioned the new MDF lines, making Russia a potential major sales market.
According to WhatWood, the Roskitinvest MDF line in the Tomsk Region will be launched in March 2016, while other investments are planned in Smolensk Region, both at Igorevsky DOK and at the Austrian Egger's mill.
At the moment, the high MDF prices, together with poor product range, extended lead time and lack of products in some areas can’t compete with the particleboard market. Once the MDF supply increases, the prices will fall. Increased competition can also be seen in the Ural Region, Kronospan competes with Kastamonu’s.
Still, there are industry sayings that the Russian MDF market is already facing oversupply. The price declined 5% in 2015 because of the falling demand and the high supplies.
Source: WhatWood; Edited by GWMI
[gravityform id="1" title="true" description="true"]
[gravityform id="2" title="true" description="true"]
US imports of tropical sawnwood on an upward trend in 2015

The volume of sawn tropical hardwood imports increased 9% in 2015 to 263,022 cu.m. valued at US$289.9 million. The share of tropical sawnwood in total US hardwood imports was 23% in 2015, unchanged from the previous year, ITTO reported.
In 2013 the tropical share was 27%, but the volume of tropical imports was lower than in 2015.
2015 imports of tropical species
| 2015 imports m3 | % change on 2014 | |
| Balsa | 53,290 | -6% |
| Sapelli | 41,392 | 7% |
| Acajou d'Afrique | 25,791 | 24% |
| Keruing | 21,578 | 10% |
| Ipe | 32,251 | 10% |
| Mahogany | 20,251 | 14% |
| Virola | 8,847 | -9% |
| Meranti | 9,675 | 11% |
| Cedro | 8,576 | -15% |
| Jatoba | 3,595 | 12% |
| Teak | 9,470 | 83% |
| Iroko | 783 | 121% |
| Padauk | 611 | 9% |
| Aningre | 569 | 129% |
| Other tropical | 26,343 | 23% |
| Total | 263,022 | 9% |
Source: US Department of Commerce, US Census Bureau,
Foreign Trade Statistic
Imports of most species grew in 2015 with the exception of balsa, virola and cedro. Balsa remained the most significant imported species at 53,290 cu.m. but the volume was 6% below 2014.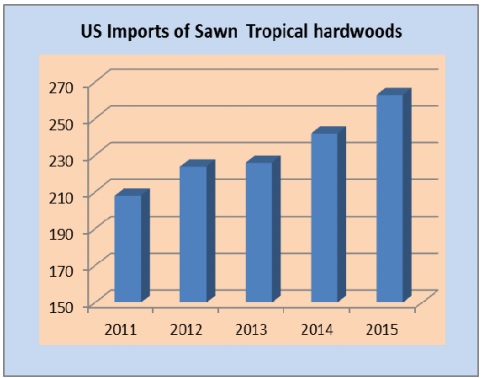
Imports of sapelli sawnwood grew 7% in 2015 to 41,392 cu.m., following a 23% increase in 2014. In third place was ipe at 32,251 cu.m., up 10% from 2014.
Imports of acajou d’Afrique sawnwood declined in 2014, but in 2015 imports increased 24% to 25,791 cu.m.
Imports of keruing were 21,578 cu.m. in 2015, up 10% from 2014. Mahogany imports grew 14% to 20,251 cu.m.
Amongst the fastest rates of increase in 2015 imports iroko, aningre and teak sawnwood stand out. Teak imports grew 83% to 9,470 cu.m. Much of the growth was in teak imports from India which supplied 4,614 cu.m. to the US.
Imports from Africa grew faster in 2015 than shipments from Latin America and Asia. Imports from Cameroon and Congo (Brazzaville) increased significantly in 2015, but Ghana and Cote d’Ivoire shipped less than in 2014.
Ecuador and Brazil remained the largest suppliers to the US market, despite lower balsa imports.
Imports from Brazil were 42,167 cu.m. in 2015, up 8%. Sawnwood imports from Malaysia and Indonesia increased by 9% and 15%, respectively, from 2014 due to higher shipments of keruing and meranti.
[gravityform id="1" title="true" description="true"]
[gravityform id="2" title="true" description="true"]
Saudi Arabia: Imports of softwood lumber up 24%

Imports of softwood lumber in Saudi Arabia recorded 24% increase during January-July 2015, compared to the similar period of 2014, according to Trade Arabia.
The results will be introduced during the 11th edition of the Dubai WoodShow 2016, which will take place from April 4 to 6 at the Dubai International Convention and Exhibition Centre (DICEC). The largest trade fair for wood products in the Middle East is organized by Strategic Marketing and Exhibitions.
As Trade Arabia reports, Saudi Arabia imports around 1.07 million cubic meters from main European and North American exporters. Until 2018, there is expected wood production growth of about 64%, together with rising demand from construction industry and households in the Kingdom.
Dawood Al Shezawi, the chief executive of Strategic Marketing & Exhibitions, stated that “this increase indicates a strong demand in the Saudi construction sector as well as the household and offices furniture. The domestic demand for wood and wood products registered strong growth to cross SR11 billion ($2.9 billion). We are gearing up to see major deals at the next edition of Dubai WoodShow from the Saudi exhibitors and we also anticipate a huge turnout of trade visitors from the kingdom.”
The three-day specialized show will also feature key innovations in the timber industry including modern technologies and products related to wood processing, such as mortising, tenoning, treenailing, beveling, gluing and inlaying.
The 11th edition of the Dubai WoodShow is set to put on display all kinds of softwood products that are made of Cedar, Fir, Pine, Redwood; and hardwood products that are made of Ash, Birch, Cherry, Mahogany, Maple, Oak, Poplar, Teak, and Walnut.
[gravityform id="1" title="true" description="true"]
[gravityform id="2" title="true" description="true"]
Netherlands: Sanctions for EUTR violation

A Dutch company has been sanctioned today for violating the European Timber Regulation, after Greenpeace has started the investigation on the Cameroonian timber trader CCT. As it turns out, the company has been sourcing timber from other companies at fault for illegal logging and exporting it to different countries in the EU.
“In its capacity as the current EU Council Presidency, the Netherlands can help bring an end to the trade in illegal timber across Europe. We call on the Dutch Government to demand a political commitment by the EU member-states to make sure European companies follow the rule of law by keeping illegal timber out of the market,” said Meike Rijksen, Forests campaigner with Greenpeace Netherlands.
According to the report that Greenpeace published last year, they traced the CCT timber to several European importers, such as Germany, Belgium, Spain and the Dutch company, Fibois BV in Purmerend. Thus, the Dutch authorities sanctioned the company.
Unfortunately, illegal logging is bursting in Cameroon, because of the high corruption and the weak control system.
“Because of the political situation in the Congo Basin, timber from Cameroon may only be placed on the market if the importer has taken sufficient mitigating measures to make sure the risk that the timber is illegally harvested is negligible,” the Dutch authorities stated in a press release.
Also, Greenpeace makes a call for the other European countries involved in the CCT illegal timber trade to take action and sanction the respective companies.
Irene Wabiwa, Forest Campaign Manager with Greenpeace Africa, said that “the Cameroonian government needs to tackle the illegalities and corruption in the timber sector. Cameroon needs to seriously work with the EU to ensure the Voluntary Partnership Agreement aimed at combatting illegal logging and strengthening forest governance in Cameroon is fully implemented.”
The full and effective implementation of the EUTR, banning illegal timber from the EU market, should be the most important step to fight illegal logging.
[gravityform id="1" title="true" description="true"]
[gravityform id="2" title="true" description="true"]
China: Average prices for imported hardwood logs in 2015

Official data from China Customs shows a sharp drop in log imports in 2015. China’s log imports in 2015 totalled 44.55 million cubic metres valued at US$8 billion, a year on year decline of 13% in 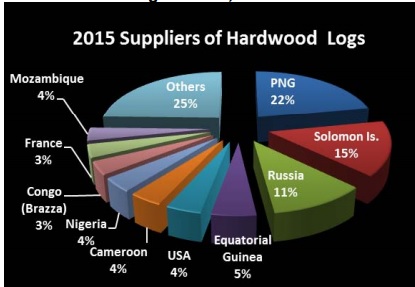 volume and 32% in value. The average price for imported (softwood+hardwood) logs was US$181 per cubic metre.
Hardwood log imports fell 6% to 14.49 million cubic metres and made up 33% of the national total.
The average price for imported hardwood logs was US$303 per cubic metre, down 27% over 2014.
Average hardwood log prices, 2015
| Average price US$/m3 | % Change 2014-2015 | |
| PNG | 209 | -14% |
| Solomon Is. | 198 | -8% |
| Russia | 157 | -9% |
| Equatorial Guinea | 272 | -24% |
| USA | 422 | -7% |
| Cameroon | 336 | -14% |
| Nigeria | 627 | -9% |
| Congo (Brazzaville) | 337 | -20% |
| France | 222 | -10% |
| Mozambique | 550 | 0 |
Source: China Customs
Hardwood log sources, 2015
| 2015 imports m3 | % Change 2014-2015 | |
| PNG | 3,162,900 | -4% |
| Solomon Is. | 2,221,900 | 1% |
| Russia | 1,628,800 | 19% |
| Equatorial Guinea | 657,800 | 32% |
| USA | 584,100 | 5% |
| Cameroon | 549,200 | 14% |
| Nigeria | 546,000 | 8% |
| Congo (Brazzaville) | 526,100 | -8% |
| France | 525,500 | 23% |
| Mozambique | 522,200 | -15% |
Source: China Customs
[gravityform id="1" title="true" description="true"]
[gravityform id="2" title="true" description="true"]
Canada: SLA renewal or new lumber markets?

It seems that Justin Trudeau’s visit to Washington won’t bring back to Canada the renewed Softwood Lumber Agreement. According to Vancouver Sun, free trade with the US in softwood lumber isn’t possible and neither is the renewal of the SLA, which managed to keep trade under control.
President Obama doesn’t want to keep the expired deal on the table, especially because of the election year. At the moment there are a lot of issues caused by the impact of the low Canadian dollar, which affects the US producers. But there is nothing to be done on Canada because of the trade litigation that doesn’t allow the US to impose tariffs on Canadian softwood lumber imports until October 2016.
A solution would be to extend the litigation trade period until a new SLA is signed, but the US Lumber Coalition asks the government to impose the new tariffs on Canadian softwood. New tariffs mean the damaging of the import duties, especially for BC. Between 2001 and 2006, when the SLA wasn’t renewed, the Canadian exporters paid $5 billion to the US, while the combination of duties summed 27% on Canadian softwood, as Vancouver Sun reports.
Canada has to think long term, even if a temporary solution would also solve the issues for the moment. The exports to the US have decreased since the US housing market started to recover and Canada has started to make new trades with China, in exports that reached 21% in 2011.
Thus, as policy analyst Naomi Christensen told Vancouver Sun, Canada should start diversifying their market because only this way they wouldn’t depend on the US anymore.
[gravityform id="1" title="true" description="true"]
[gravityform id="2" title="true" description="true"]
Global trade of softwood lumber reaches 10-year high in 2015
A majority of the 20 largest softwood lumber-consuming countries in the world increased their importation of lumber in 2015, resulting in global trade reaching its highest level in ten years. The US imported 10% more lumber year-over-year and a number of countries in Europe also raised their consumption of imported lumber last year.
North America
The US lumber market was a bright spot as compared to most other regions of the world in 2015. As a result of a healthy housing market, lumber consumption was up almost five percent as compared to 2014 and import volumes in 2015 were 10 percent higher than in the previous year. The strong domestic market and a weakening Asian market also resulted in less lumber being exported in 2015, as reported by Wood Resource Quarterly (WRQ). Export shipments were down 9.7%, while imports were up 10% from 2014.
Lumber exports from Canada reached an eight-year high in 2015 when sawmills took advantage of the fairly strong US lumber market, which combined with the weak currency, allowed them to ship 9.2% more lumber to the US than in 2014. Shipments to China, on the other hand, fell over 13% to the lowest level since 2010.
Northern Europe
Lumber prices in the Nordic countries have trended downward since early 2014, in US dollar terms, as the dollar has strengthened against both the Euro and the Swedish krona.
From the five-year high in March 2014, prices in Sweden have fallen almost 30%.
During 2015, Swedish sawmills increased export volumes by almost five percent as compared to the previous year, reaching the highest annual shipment since 2006. Of the ten largest consumers of Swedish lumber, Germany, the Netherlands and China increased their import shipments from Sweden the most.
The Finnish sawmilling industry experienced a similar trend as that of Sweden with higher export volumes in 2015. The biggest expansions in shipping volumes were to China, Japan and Israel.
China
Although importation of softwood lumber to China fell by two percent in 2015 from the previous year, Russian volumes were up by almost 20 percent year-over-year. Russia is now the largest supplier of lumber to China and had a market share of 52 percent last year.
Lumber import prices fell throughout 2015 with average values in December being 24 percent lower than in the same month in 2014. Current import prices are at their lowest level in over ten years.
Japan
Demand for wood in Japan has fallen the past two years partly as the result of an eight percent decline in housing starts. Domestic lumber production fell an estimated nine percent from 2013 to 2015, and lumber import volumes were down 20% from 2013.
Lumber prices have been fairly stable in both US dollar and Yen terms over the past 12 months. The only exceptions have been European whitewood, which increased eight percent from January 2015 to January 2016, and Canadian hemlock, which was up four percent over the same time period.
Russia
Russia continues to be the world’s second largest softwood lumber exporter behind Canada, accounting for about 22% of globally traded lumber in 2015. Shipments were up to practically all markets with the exception of the CIS countries, which imported 19 percent less in 2015. Russian lumber export prices have now trended downward for two years.
[gravityform id="1" title="true" description="true"]
[gravityform id="2" title="true" description="true"]
CanWel to acquire Jemi Fibre

CanWel Building Materials Group Ltd. and Jemi Fibre Corp. have entered into a definitive agreement whereby CanWel will acquire all of the issued and outstanding common shares of Jemi Fibre.
The implied equity value of Jemi is approximately CA$11 million. CanWel also expects to assume total indebtedness of approximately CA$25 million and refinance approximately CA$50 million of Jemi Fibre’s senior loans.
The transaction will result in Jemi Fibre becoming a wholly-owned subsidiary of CanWel and will combine Jemi Fibre’s operations with CanWel’s well-established Canadian platform.
Jemi Fibre is a vertically-integrated forest products company that operates primarily in British Columbia and Saskatchewan. Jemi Fibre owns approximately 136,000 acres of private timberlands, strategic crown licenses and tenures, log harvesting and trucking operations, several post and pole peeling facilities, two pressure-treated specialty wood production plants, and one specialty sawmill.
[gravityform id="1" title="true" description="true"]
[gravityform id="2" title="true" description="true"]
Wood biomass- a primary source of renewable energy in UNECE region

Wood energy accounts for 3.5% of the total primary energy supply (TPES) and 38.2% of the renewable energy supply (RES) in the UNECE region, making it the first source of renewable energy in the region.
Wood biomass covers 21 to 23% of the primary energy demands of Finland and Sweden and 14 to 16% of the primary energy demands of Estonia and Austria. Wood biomass accounts for over half of the renewable energy supply in the Nordic and Baltic states as well as in Armenia, Republic of Moldova, Serbia, Slovenia, Czech Republic and Luxembourg. Around 42% of the total mobilized wood biomass supply is used for energy purposes.
These are the main findings of the biennial UNECE/FAO Joint Wood Energy Enquiry (JWEE), which promotes cross-sectoral communication and cooperation between the energy and forestry sectors in member States.
Sources of wood energy
Co-products and residues from the forest-based industries contribute 62% of the wood fibres for energy generation. Processed wood fuels with improved energy content such as wood pellets, briquettes and charcoal are also included under this category. 31% of the wood fibres for energy generation derive directly from woody biomass from forests and wooded areas outside forests.
 However, the proportion varies among countries with Armenia, Hungary, Macedonia, Moldova, Azerbaijan, Serbia, Croatia, Bosnia and Herzegovina, Slovenia and Czech Republic relying heavily (60% or more) on direct supplies (such as firewood) of wood fibres whereas countries such as the United States, Canada, United Kingdom, Ireland, Sweden, Austria and Finland rely mainly (60% or more) on wood supply from indirect sources such as co-products.
The United States (48%), Sweden (42%), Finland (41%) and Canada (29%) have large shares of energy generated from black liquor reflecting the relative importance of the pulp and paper industries in the forest sector for the generation of wood energy. Overall, recovered waste wood (mainly waste from construction, but also packaging and old furniture) constitutes a minor category contributing 4.5% of wood energy. It is mainly consumed in power applications and waste to energy plants.
Uses of wood energy
Wood energy is consumed by industry (49%) and final consumers (34%). Forest-based industries account for 75% of industrial use and households account for 93% of final consumption. The highest shares of industrial use are in Canada, the United States, Ireland, Sweden and Finland. The forest products industry typically consumes energy generated from the solid and liquid co-products of its manufacturing processes. Countries with important forest industries, such as Finland, Sweden, Canada and the United States therefore have a higher share of industrial consumption. Residential use, mainly dependent on primary solid biomass sources, is prevalent in most reporting countries except Canada, Cyprus and Iceland where mainly wood charcoal is used for energy generation in the residential sector.
The power and heat sector is the most important consumer of wood energy in Denmark, Netherlands and the United Kingdom, and has relatively large shares in Estonia, Switzerland, Sweden, Finland, Austria and Ireland.
Consumption of wood pellets further increased as 38.8 kg of wood pellets were consumed per capita in the countries that reported figures from 2007 to 2013, an increase of 144% compared to 2007.
[gravityform id="1" title="true" description="true"]
[gravityform id="2" title="true" description="true"]
30% growth in US hardwood flooring imports in 2015
US imports of wood flooring increased again in 2015, following a year of significant growth in 2014.
Hardwood flooring imports were worth US$47.4 million in 2015, up 30% from 2014. Imports from all countries increased, but the strongest growth was in Canadian shipments where manufacturers benefited from the weak Canadian dollar, ITTO reported.
Indonesia and Malaysia were the largest sources of imports at US$10.7 million and US$10.1 million, respectively. Hardwood flooring imports from Indonesia grew by over half from 2014. Imports from China were worth US$8.7 million, up 19% from the previous year.
Imports of assembled wood flooring panels were worth US$136.5 million, up 3% from 2014.
The strongest growth was in imports from Canada, while assembled wood flooring imports from China fell 10% in 2015 to US$60.7 million. Indonesia exported US$8.1 million worth of assembled flooring panels to the US in 2015, up 6% from the previous year.
Decline in hardwood moulding imports
The value of hardwood moulding imports into the US declined 5% in 2015 from the previous year, despite the growth in home construction. Hardwood moulding imports were worth US$194.2 million, down from US$204.6 million in 2014.
Imports from all major suppliers decreased. China remained the largest source of imports at US$65.3 million. Imports from Brazil were worth US$48.4 million, down 9% from 2014. Imports from Malaysia declined 10% to US$13.4 million.
[gravityform id="1" title="true" description="true"]
[gravityform id="2" title="true" description="true"]
Britain's Travis Perkins expects 2-3% market growth for 2016

British Travis Perkins plc expects 2-3% market growth in 2016, after annual pre-tax profit of £224 million in 2015. From the £321m profit in 2014, 2015 brought a 30% decrease, but the adjusted pre-tax profit increased by 5.5%, reaching £382m.
Due to 53 new branches, stores and implants that were added to the network in 2015, the Travis Perkin’s sales increased by 6.5%, reaching £5.9bn, compared to the £5.5bn gained in 2014. Still, the company reported a slow RMI for the second half of 2015, but they’re confident that the market will remain positive and should recover in the first half of 2016.
John Carter, CEO of Travis Perkin, said that they “believe that the growth drivers in our markets remain strong and welcome the return to growth of mortgage approvals and secondary housing transactions in the second half of 2015.”
Also, they expect 5-6% sales growth in 2016, as the RMI has grown during January and February. The company extended ranges of 16,000 products for delivery within 72 hours, due to investments in the distribution network.
In addition, the investments that the company is making to improve customer propositions, optimise the network, exploit scale advantage and efficiently manage the portfolio of businesses provide confidence that Travis Perkin can continue to outperform and improve returns.
[gravityform id="1" title="true" description="true"]
[gravityform id="2" title="true" description="true"]
Britain’s Travis Perkins expects 2-3% market growth for 2016
British Travis Perkins plc expects 2-3% market growth in 2016, after annual pre-tax profit of £224 million in 2015. From the £321m profit in 2014, 2015 brought a 30% decrease, but the adjusted pre-tax profit increased by 5.5%, reaching £382m.
Due to 53 new branches, stores and implants that were added to the network in 2015, the Travis Perkin’s sales increased by 6.5%, reaching £5.9bn, compared to the £5.5bn gained in 2014. Still, the company reported a slow RMI for the second half of 2015, but they’re confident that the market will remain positive and should recover in the first half of 2016.
John Carter, CEO of Travis Perkin, said that they “believe that the growth drivers in our markets remain strong and welcome the return to growth of mortgage approvals and secondary housing transactions in the second half of 2015.”
Also, they expect 5-6% sales growth in 2016, as the RMI has grown during January and February. The company extended ranges of 16,000 products for delivery within 72 hours, due to investments in the distribution network.
In addition, the investments that the company is making to improve customer propositions, optimise the network, exploit scale advantage and efficiently manage the portfolio of businesses provide confidence that Travis Perkin can continue to outperform and improve returns.
[gravityform id="1" title="true" description="true"]
[gravityform id="2" title="true" description="true"]
Global paper and forest products industry outlook stable, says Moody's

The outlook for the global paper and forest products industry is stable, says Moody's Investors Service. The ratings agency noted its outlook reflects expectations that the consolidated operating income of the 46 paper and forest product companies that Moody's rates globally will increase by 0%-2% over the next 12-18 months.
Moody's expects that the consolidated operating income of the 28 North American companies it rates will remain essentially flat, with 0%-2% growth over the outlook period. These companies account for about 60% of the global rated industry's operating income. Flat to modest operating income growth from paper packaging, pulp, wood products and timberland producers will be offset by lower operating earnings from paper companies. Within this group, the eight North American timberland and wood products companies, such as Rayonier Inc. (Baa2 stable), West Fraser Timber Co Ltd (Baa3 stable) and Norbord Inc. (Ba2 stable), will benefit as the demand for new US housing increases about 10% in 2016.
Moody's indicated that operating earnings growth for producers in Latin America will remain unchanged at 1%-3%. The depreciated local currency will continue to mitigate weak international prices and support local operating margins. Weaker than normal economic expansion in Lain America will limit local paper demand growth. This will be partially offset by higher per capita paper use, as paper consumption in this region increases towards global average levels.
In Europe, earnings growth for Moody's rated European producers will be 0%-2%. The producers account for nearly 25% of the industry's total operating income. Within the region, increased operating earnings from packaging and tissue operations will outweigh those from paper operations, which continue to face the continued secular decline of paper consumption in developed markets.
Moody's analysts said they expect to see an increase in operating income from European wood-based building producers as larger investments in homebuilding and renovations strengthen demand for lumber and panels. Packaging volume is also expected to grow as the European economy improves.
"Outside of wood product companies that are positioned to capitalize on the US housing recovery, weaker prices across most grades will limit operating earnings growth for most rated paper and forest products companies," said Moody's Vice President Ed Sustar.
"The continuing weakness in the euro, Brazilian real and other currencies against the US dollar should boost exports from companies operating in these currencies into markets where the commodity price is denominated or pegged to the US dollar, as the strong dollar erodes the cost competitiveness of US producers," he concluded.
[gravityform id="1" title="true" description="true"]
[gravityform id="2" title="true" description="true"]
Global paper and forest products industry outlook stable, says Moody’s

The outlook for the global paper and forest products industry is stable, says Moody's Investors Service. The ratings agency noted its outlook reflects expectations that the consolidated operating income of the 46 paper and forest product companies that Moody's rates globally will increase by 0%-2% over the next 12-18 months.
Moody's expects that the consolidated operating income of the 28 North American companies it rates will remain essentially flat, with 0%-2% growth over the outlook period. These companies account for about 60% of the global rated industry's operating income. Flat to modest operating income growth from paper packaging, pulp, wood products and timberland producers will be offset by lower operating earnings from paper companies. Within this group, the eight North American timberland and wood products companies, such as Rayonier Inc. (Baa2 stable), West Fraser Timber Co Ltd (Baa3 stable) and Norbord Inc. (Ba2 stable), will benefit as the demand for new US housing increases about 10% in 2016.
Moody's indicated that operating earnings growth for producers in Latin America will remain unchanged at 1%-3%. The depreciated local currency will continue to mitigate weak international prices and support local operating margins. Weaker than normal economic expansion in Lain America will limit local paper demand growth. This will be partially offset by higher per capita paper use, as paper consumption in this region increases towards global average levels.
In Europe, earnings growth for Moody's rated European producers will be 0%-2%. The producers account for nearly 25% of the industry's total operating income. Within the region, increased operating earnings from packaging and tissue operations will outweigh those from paper operations, which continue to face the continued secular decline of paper consumption in developed markets.
Moody's analysts said they expect to see an increase in operating income from European wood-based building producers as larger investments in homebuilding and renovations strengthen demand for lumber and panels. Packaging volume is also expected to grow as the European economy improves.
"Outside of wood product companies that are positioned to capitalize on the US housing recovery, weaker prices across most grades will limit operating earnings growth for most rated paper and forest products companies," said Moody's Vice President Ed Sustar.
"The continuing weakness in the euro, Brazilian real and other currencies against the US dollar should boost exports from companies operating in these currencies into markets where the commodity price is denominated or pegged to the US dollar, as the strong dollar erodes the cost competitiveness of US producers," he concluded.
[gravityform id="1" title="true" description="true"]
[gravityform id="2" title="true" description="true"]
Canada: Lumber production went 8% up in 2015

The Canadian lumber production increased by 8% in 2015, compared to 2014. Thus, production summed 26.7 billion board feet, out of which, BC’s output got to 13.2 bbf, going 5% up. At the same time, the share BC in the nation’s output went down under 50%, from 51% last year.
BC’s Northern Interior summed 6.3 bff, going up by 12% compared to 2014, passing on all the provinces. The next in total lumber production gains was Quebec, which rose by 10%, reaching 5.8 bff. BC’s Southern Interior registered a 2% drop, reaching 5.4 bff.
All of Canada’s production in December went 5% down, compared to November, at 2.2 bff. Also, Quebec's production fell down to 487 million board feet, from its 543 mmbf reached in November 2015. Except Alberta, where lumber production dropped 7%, all the other Canadian provinces recorded approximately a 1% drop compared to November.
[gravityform id="1" title="true" description="true"]
[gravityform id="2" title="true" description="true"]
Japan: Imports of structural laminated lumber stable in 2015

Structural laminated lumber market in Japan is now stable, even if imports decreased two years in a row. Still, since 2013, the volume of structural laminated lumber has been over 700,000 cbms every year, as ITTO reported.
In 2015, the total import of structural laminated lumber was 705,000 cbms, 3.1% less than in 2014. The market was slow in 2015 because the demand decreased after the taxes increased in 2014. Thus, the prices also declined, especially for laminated beam, which dropped 6,000 yen per cbm, compared to 2014.
Sawmilling companies have restrained future purchases because they fear a price drop. Instead, they shifted to purchase from domestic manufacturers, that offer them a shorter delivery time, according to ITTO.
Regarding the industrial laminated lumber supply, the imports dropped after the Sorenau plant in Austria of Stora Enso closed. While Radauti plant of H.Schweighofer in Romania started production, Japan increased the supply by importing from Romania.
[gravityform id="1" title="true" description="true"]
[gravityform id="2" title="true" description="true"]
Illegal timber trade between China and Myanmar has slowed down

The volume of illegal timber traded between Myanmar and China in the last 6 months has encountered a downturn, as the Environmental Investigation Agency (EIA) reports. The agency’s report in September 2015 showed that via the land border between Myanmar’s Kachin State and China’s Yunnan Province there were illegal trades of logs. These trades reached 900,000 m3 of wood in 2014, worth almost half a billion dollars.
“The sharp fall in timber volumes being smuggled into China provides a much-needed breathing space for the precious forests of Myanmar,” said EIA Forest Campaign Leader Faith Doherty in a statement.
One year ago, EIA documented long lines of trucks queuing to carry valuable logs across the border. This year only small amounts of precious woods are being smuggled via backroads on motorbikes or passenger vehicles. At the N’bapa-Banling unofficial crossing, controlled by a major syndicate called BDYA and one of the busiest routes last year, the trade has come to a virtual halt. Further north at the Kambaiti-Houqiao official border point, the same situation was observed.
A combination of factors is likely responsible for the timber smuggling slowdown. Respectively, the huge volumes of timber which flowed across the border over the past few years created a glut in the market, especially in valuable rosewood species, the price of which had fallen. Other contributory factors include the economic slowdown in China and Myanmar’s General Election last November, as the EIA reported.
Still, without formal measures to permanently halt timber trade across the border it could quickly resume once the log piles on the Chinese side of the border dwindle and timber prices rise again due to scarcity.
[gravityform id="1" title="true" description="true"]
[gravityform id="2" title="true" description="true"]
Sweden: Softwood lumber exports grow considerably in 2015
In the first eleven months of 2015, Sweden has exported about 11.7 million cubic meters of sawn and planed softwood lumber. This represents a 15% increase over the same period of 2014. Main export markets for the Swedish lumber were the United Kingdom and Egypt, followed by Germany and Norway. In particular, exports to Egypt dropped by -11% over January-November 2014, down to a volume of 1,17 million cbm, a signal that the overall political crisis in the country is influencing exports.
Overall, the increase in Swedish exports was supported by larger deliveries to Great Britain, Germany and the Netherlands. But even to Denmark, Algeria, China and Japan considerably more was exported.
Swedish shipments to the European Union countries have increased by 18%, with over 6,34 million cubic meters exported.
A significant surge was recorded in exports to the United States. Even though the export volumes are lower than to other major Swedish lumber destinations, Sweden's lumber shipments increased up to 246,000 cubic meters, a 145% as compared to January-November 2014.
Despite the downturn the in Egypt, exports to North Africa remained flat at 2,27 million cubic meters. Shipments to Algeria, Morocco and Tunisia increased considerably, balancing the drop in Egypt.
On contrast, Swedish lumber deliveries to Asia managed to increase by 21%. Exports to Japan were almost 80,000 cbm higher than in the same period of 2014. Exports to China rose by 20%, up to 485,000 cbm.
A significant drop can be noticed in the average export value of the Swedish softwood lumber. The average export price in January-November 2015 was 208.71 EUR cbm, 4.6% lower than in the same period of last year.
| Country | I-XI 2014 |
I-XI 2015 |
Change in % |
| United Kingdom | 2,197,532 | 2,526,512 | +15% |
| Egypt | 1,328,066 | 1,179,620 | -11% |
| Germany | 786,802 | 948,416 | +21% |
| Norway | 778,510 | 860,137 | +10% |
| Denmark | 682,869 | 786,397 | +15% |
| Netherlands | 654,497 | 811,542 | +24% |
| Japan | 517,148 | 595,484 | +15% |
| Algeria | 485,816 | 535,865 | +10% |
| China | 406,253 | 485,574 | +20% |
| Morocco | 339,369 | 399,973 | +18% |
| Saudi Arabia | 288,644 | 375,933 | +30% |
| Belgium | 261,170 | 304,805 | +17% |
| France | 266,638 | 289,150 | +8% |
| USA | 100,530 | 246,262 | +145% |
| Exports to EU | 5,368,948 | 6,349,340 | +18% |
| Exports to North Africa | 2,282,148 | 2,271,395 | 0% |
| Exports to Near and Middle East | 493,289 | 549,100 | +11% |
| Exports to other Asian countries | 1,067,615 | 1,290,128 | +21% |
| Exports to the world | 10,217,281 | 11,770,654 | +15% |

